Browse categories
Explore
Fiverr Pro
English
$
USD
Hello,
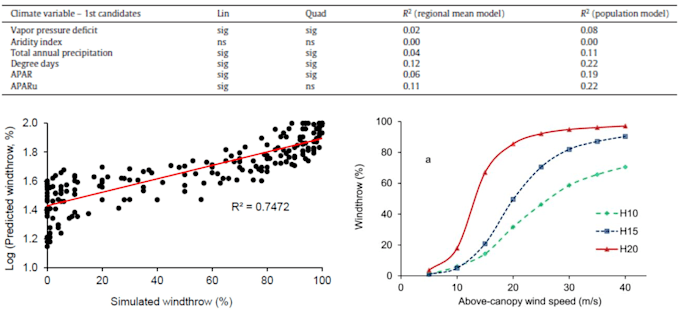
Do you need help in generating compelling insights from your data? I'm a data expert with over a decade of experience handling all kinds of data from environment science to health to wage growth data. I'm seasoned at conducting statistical analysis, building visualizations and modeling/forecasting trends.
Here is a sample of my services;
Please contact me if you have any questions, so I understand what you need.

What is different with your service?
Data processing and deriving insights is something I really enjoy doing and when people love what they do, the product is different. I teach this to University students so you are getting services from an academic.
I am not too sure what type of analyses need to be done, can you help?
Certainly, I can help determine the appropriate analysis to answer your data needs. Send me your data and insights your would like to generate and we'll take it from there.