Browse categories
English
$
USD
Connect to your AI
Grant Proposal Writer and R Biostatistics Expert, MSc Biotechnology
Need clear statistics and clean graphs for your research data?
I'm a biotechnologist (MSc, Poznań University of Life Sciences), not just a programmer. I understand your experiment, which helps me choose the right test and explain the results in plain language.
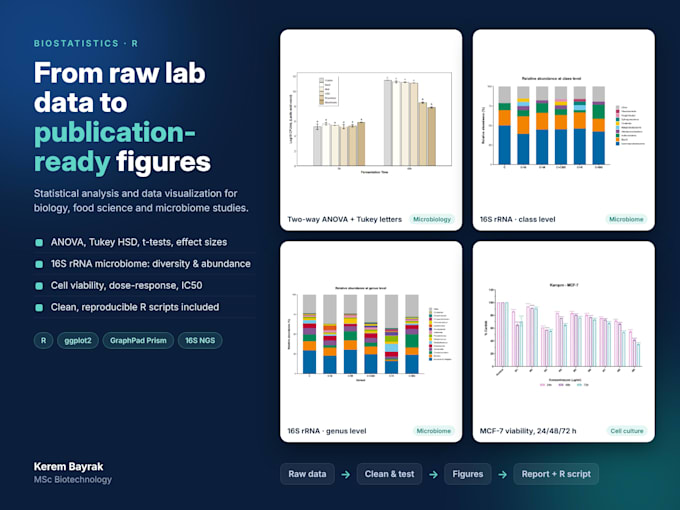
My own research included 16S rRNA microbiome data, bacterial growth and cell viability assays, all analysed in R. The graphs in the gallery are from that work.
What you get:
- The right statistical test for your design, with assumptions checked
- Clear results: p-values, effect sizes, post-hoc comparisons
- Journal-style graphs (ggplot2), with significance letters or asterisks, at 600 dpi
- A short report explaining what the results mean
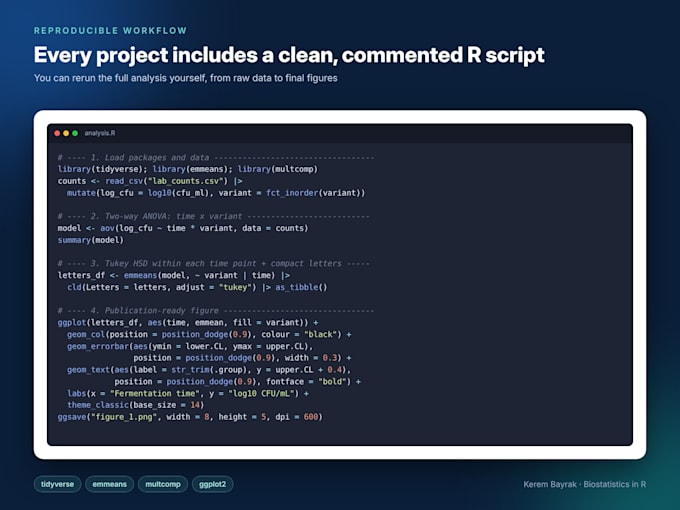
- A clean, commented R script, so you can rerun everything
Typical work:
- t-tests, one-way and two-way ANOVA, Tukey HSD
- Non-parametric tests (Kruskal-Wallis, Mann-Whitney)
- Dose-response curves and IC50
- Microbiome: alpha/beta diversity, relative abundance
Not sure which package fits? Message me before ordering with a short description of your data.


Technology:
Excel
•
JASP
•
Other
Expertise:
Experiment design
•
Statistics
•
Hypothesis testing
•
Other
Programming language:
R
Tools:
RStudio
•
Microsoft Excel
•
Other
I don't know which statistical test I need. Can you help?
Yes. Tell me how your experiment was designed and what you want to compare. I'll choose the right test and explain why before running anything.
Do you work with microbiome / 16S rRNA data?
Yes. I can work with ASV/OTU tables or taxonomy outputs to create relative abundance plots, alpha/beta diversity analysis and group comparisons. Please message me first so I can check your file format.
Can you match my journal's figure requirements?
Yes. Send me the author guidelines and I'll match size, font, resolution and file format (PNG, PDF, TIFF or EPS).
I don't use R. Is that a problem?
No. You get finished graphs and a results report either way. The R script is a bonus for reproducibility, or if a reviewer asks for it.
Will my data stay confidential?
Yes. Your data is used only for your order, never shared, and deleted after delivery on request.