I will use excel for descriptive statistics, data analysis, visualization

India

I speak English, Hindi

6 orders completed

I am a data analyst proficient in SQL, Excel and Python. I am familiar with Pandas(used for Data Manipulation and analysis),Matplotlib and Seaborn(used for data visualization)
About this Gig

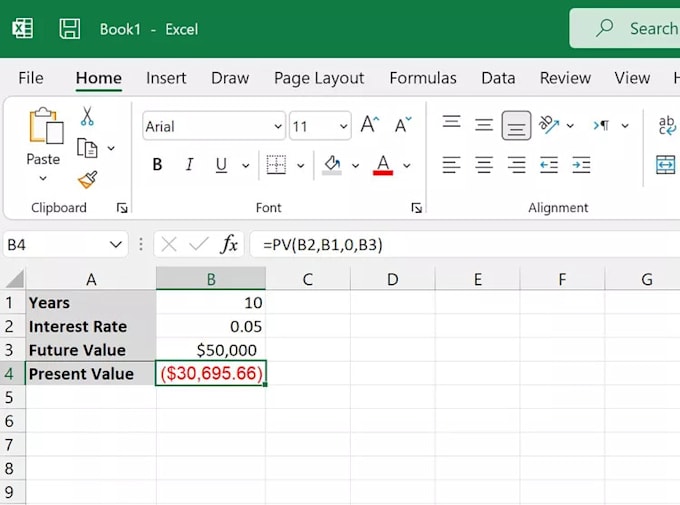
I will use Excel for data analysis in a variety of ways, including:

  • Summarizing data sets
  • Pivot tables to organize and rearrange statistics to highlight important facts.
  • Visualizing data
  • Charts can graphically represent data to help users understand patterns and trends.
  • Performing calculations
  • Formulas can be used to perform complex calculations on data.
  • What-If Analysis
  • Cleaning data
  • Statistical analysis
  • Emphasizing data ie. conditional formatting


Programming language:

Python

Technology:

Excel

Analysis Type:

Statistical Analysis

Descriptive Analysis

Expertise:

Trends

Statistics

Tools:

Other

Other Data Analytics Services I Offer

Related tags