Browse categories
Explore
Fiverr Pro
English
$
USD


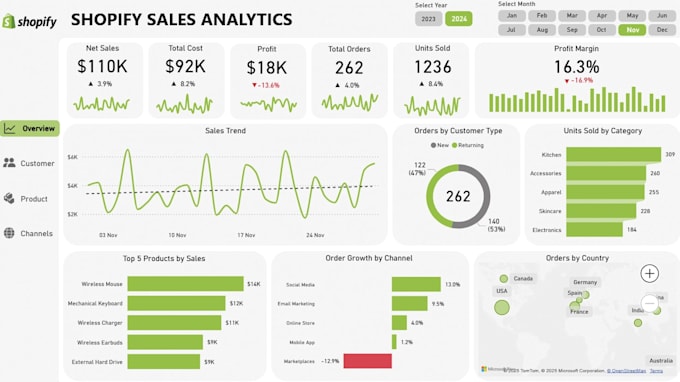
Whether you have an Amazon or Shopify or any other business, I will help you build dynamic dashboards using DAX measures, Power Query, advanced data modeling and visualization techniques in Power BI, Looker and Metabase. My expertise lies in transforming raw data into insightful, interactive reports that enable better decision-making and performance tracking.
What I Deliver:
Transform raw data into powerful, easy-to-understand dashboards!
Contact me today to discuss your requirements and get a custom solution.
Data Analytics and Engineering
Languages
1. What tools do you use to create dashboards?
I specialize in Microsoft Power BI, Tableau, and Looker Studio for dashboard creation. Additionally, I use Python libraries like Seaborn and Matplotlib for data visualizations.
2. Can you help clean raw data before creating a dashboard?
Yes, absolutely! I can clean and transform your raw data using Power Query, DAX Measures, or Python, ensuring it's ready for analysis and visualization.
3. Do you offer custom dashboards based on specific business needs?
Yes, every dashboard I create is tailored to align with your business goals and provide measurable value. Feel free to share your requirements, and I’ll design a solution accordingly.
4. What certifications do you have?
I am certified in Data Analytics by Google and IEC, with experience in multiple projects. These certifications back my expertise in data cleaning, analysis, and visualization.
5. Can you explain the insights from the dashboard in layman’s terms?
Of course! I ensure that my dashboards and insights are simple and easy to understand, even for those without technical knowledge.
6. Do you handle large datasets?
Yes, I can work with datasets of varying sizes, from small to large, ensuring efficiency and accuracy at every step.
7. Can you create visualizations using Python?
Yes, I have experience with Python libraries like Seaborn and Matplotlib to create impactful data visualizations.
8. How long does it take to complete a project?
The timeline depends on the complexity of your project. However, I’ll provide a clear timeline once I understand your requirements.
9. What industries have you worked with before?
I’ve worked with clients from e-commerce, real estate, marketing, and various other sectors, providing tailored analytics and visualization solutions.
10. Do you provide support after delivering the project?
Yes, I provide support and am happy to make adjustments if needed. Your satisfaction is my priority!