I will create an interactive 3d globe visualization

L
lalichidrashvil
L
lalichidrashvil
Lali Ch.

About this gig

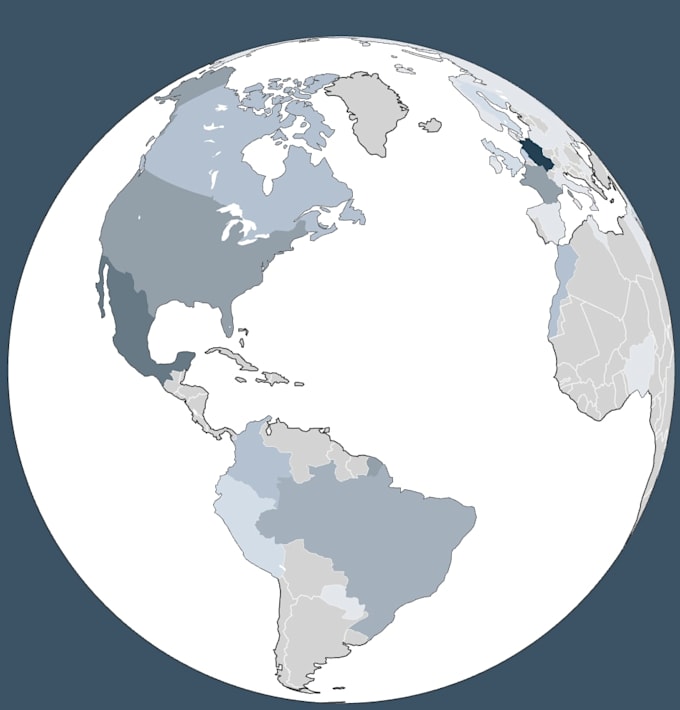
I create interactive 3D globe visualizations using D3.js, designed to clearly present geographic and country-level data in an engaging and intuitive way.


What you'll get:

  • A custom interactive 3D globe based on your data
  • Country highlighting with hover tooltips
  • Smooth rotation and user interaction
  • Responsive, web-ready visualization
  • Clean, reusable, production-ready code


Please message me before ordering so we can align on scope, data format, and expectations.


Portfolio example:

lali.dev/project/globe

Get to know Lali Ch.

Lali Ch.

D3 js charts, dashboards, and maps

  • FromGeorgia
  • Member sinceFeb 2022
  • Avg. response time1 hour
  • Languages

    English, Georgian
I create interactive data visualizations using D3.js and modern JavaScript frameworks. I specialize in transforming complex data into transparent, intuitive, and visually appealing charts, dashboards, and maps. I work with: - D3.js for custom, high-quality data visualizations - React & Svelte for responsive data-driven applications - Mapbox & Maplibre for interactive maps and geospatial visualizations With experience in financial data, I focus on accuracy, clarity, and meaningful storytelling through visuals.