Browse categories
English
$
USD
Connect to your AI

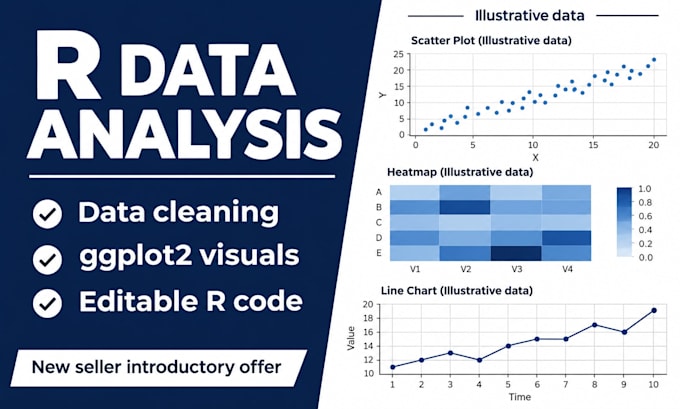
Turn your CSV or Excel data into clear ggplot2 charts with editable R code. I focus on small, well-defined data cleaning and visualization tasks you can reproduce.
New to Fiverr, I offer introductory prices to build my reputation through careful work and clear communication. Start with a $5 plot to see how I work.
Basic: 1 clean dataset, up to 500 rows/10 columns, 1 basic plot in PNG/PDF and R script.
Standard: 1 dataset, up to 1000 rows/20 columns, basic type and missing-value checks, up to 3 plots and commented R code.
Premium: 1 dataset, up to 2000 rows/30 columns, basic cleaning, up to 5 plots, a short HTML exploratory report and code.
Basic charts include bar, scatter, line, boxplot, histogram and simple heatmap. Multi-panel figures need agreement first. Each package includes 1 revision within the original scope.
Please message me before ordering with a de-identified data sample, goals and deadline. Data merging, scraping, bioinformatics, Shiny, machine learning and complex statistical models are excluded and need a separate quote. New datasets or questions are extra.
SPSS and R Data Analysis, Meta Analysis
Languages
Will I receive editable R code?
Yes. Every package includes the R script used for the agreed task, plus PNG/PDF charts. Standard and Premium include commented code, and Premium adds a short HTML exploratory report. Please confirm desired plot types, labels, colors and dimensions before ordering.
What counts as basic cleaning and a revision?
Basic cleaning covers agreed type conversions, missing-value checks and simple recoding in one dataset. Extensive cleaning or merging needs a separate quote. One revision covers corrections or adjustments to the agreed plots and scope; new datasets, questions or additional charts are extra.
