Browse categories
Explore
Fiverr Pro
English
$
USD
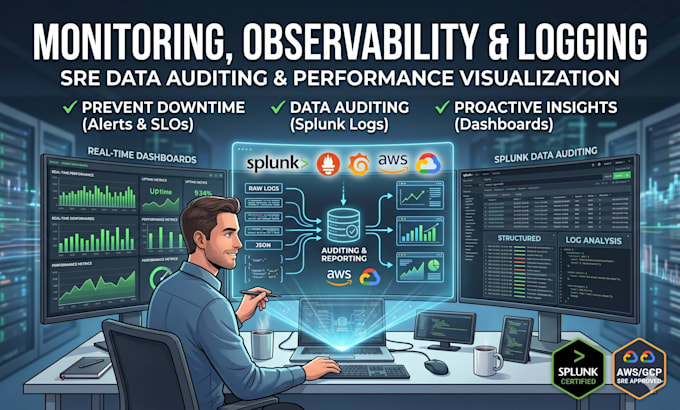
Find out your application is down before your customers complain on social media.
You can't fix what you can't see. I build comprehensive observability stacks that give you x-ray vision into your infrastructure. From writing advanced Splunk queries for deep data auditing to building real-time metric visualizations, I ensure you have the exact data you need to act fast and minimize downtime.
What you get:
Stop guessing why things break. Message me today to get total visibility into your tech stack!

Which monitoring tools do you specialize in?
My core stack includes Splunk, Prometheus, Grafana, and the ELK stack (Elasticsearch, Logstash, Kibana).
Can you write custom queries for my logs?
Yes, I specialize in advanced data auditing and can write complex Splunk queries (SPL) or PromQL to extract exactly the metrics you need from your raw logs.
Can you set up alerts to ping my team on Slack?
Absolutely. I can configure webhooks to route critical alerts directly to your Slack, Microsoft Teams, or PagerDuty.
