I will create professional data visualizations and chart

L
leechee_93
L
leechee_93
Leez

About this gig

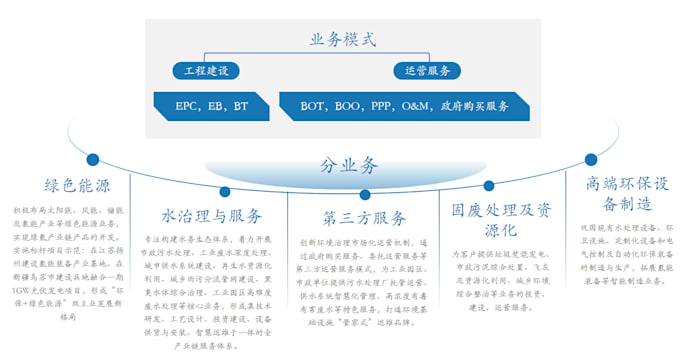
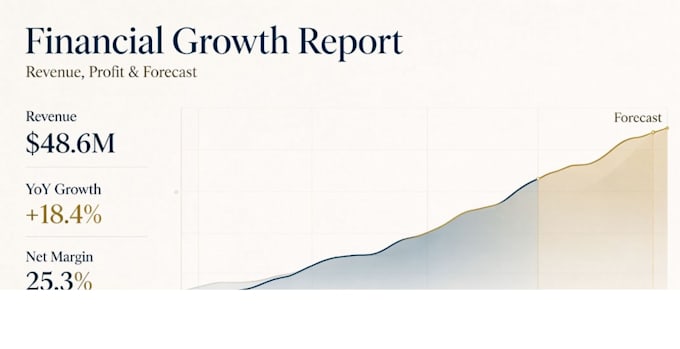
I make clear, polished static charts and graphs to turn raw data into readable visuals for academic essays, theses and business reports. I can build comparison charts, distribution plots and time-series charts using Excel and Python.

All deliverables include high-resolution Excel file + PNG image. Please send your dataset, chart type requirement and preferred color style before placing your order.


Standard chart : Up to 3 charts, 2 revisions

Extra services available: faster delivery, extra charts, additional revisions and style variations.

Feel free to message me if you have any questions before ordering!

Get to know Leez

Leez

Bilingual Creator

  • FromHong Kong
  • Member sinceNov 2026
  • Avg. response time1 hour
  • Languages

    Chinese, English
Hi, I'm Leechee — a Hong Kong–based creator What I do: • Video editing — cutting, subtitles, transitions, colour grading for short videos • Copywriting — social captions, product descriptions, blog posts, scripts and email copy, in English and Chinese • Chinese ⇄ English translation — accurate, natural-sounding, localised output (never machine-translated) • Photo editing- portrait retouching, filters, colour grading, photo collage & layout, and poster creation. I'm detail-obsessed and quick to reply. Send me your files and a short brief — I'll confirm the scope before we start.