I will create python data visualizations

L
lekhana_bc
L
lekhana_bc
Lekhana B

About this gig

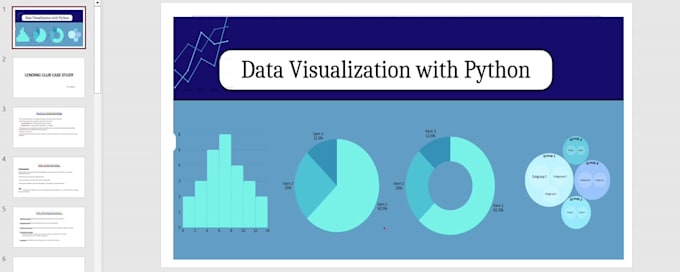
Python Data Visualization | Matplotlib, Seaborn & Plotly Charts


What I Offer:

  • Create high-quality static & interactive charts (bar, line, pie, scatter, box, histogram)
  • Data cleaning & preprocessing
  • Exploratory Data Analysis (EDA) for trends & patterns
  • Provide Python code & publication-ready charts
  • Deliver insights for reports, presentations, or business analysis

Tools:

Python, Pandas, Matplotlib, Seaborn, Plotly


Packages:

Basic: Chart creation only (no analysis)

Standard: Data cleaning + Basic EDA + Charts + Summary report

Premium: Full EDA + Interactive charts + Insights + ML-ready dataset

Get to know Lekhana B

Lekhana B

Professional data analysis and visualization for business decision

  • FromIndia
  • Member sinceAug 2025
  • Languages

    English
I’m Lekhana, a Data Analyst with 5+ years of IT experience in Technical support, Incident management, and Data analysis. Currently upskilling with an Artificial Intelligence/Machine Learning Post Graduate course from IIITB & UpGrad. I help businesses clean messy data, automate reports, and create dashboards for faster decisions. Skilled in Excel, SQL, Python and visualization. I’ve worked on loan data analysis, default prediction, waste image projects and many more . Let’s make your data simple and actionable—contact me for tailored solutions

My Portfolio

Related tags