Browse categories
Explore
Fiverr Pro
English
$
USD

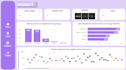


Welcome to my Exploratory Data Visualization Gig!
Do you have raw, messy, or complex data that you need to make sense of? I will transform your datasets into clean, impactful, and interactive visual stories using Python (Pandas, Matplotlib, Seaborn, Plotly) or Power BI/Tableau.
What I will do for your data:
Exploratory Data Analysis (EDA): Uncover hidden patterns, trends, and correlations.
Interactive Charts & Dashboards: Build custom, beautiful visuals (Bar, Line, Scatter, Heatmaps, Distribution plots) that are easy to understand.
Actionable Insights: Summarize key takeaways from your data so you can make data-driven decisions.
Data Preparation: Handle basic filtering and structural formatting to make sure the visuals are accurate.
What you will receive:
A clean, professionally styled report or dashboard with up to 5 custom charts.
The complete Python source code (.ipynb Jupyter Notebook) or dashboard file.
Why choose me?
Eye-catching, meaningful visualizations (no generic, cluttered charts).
Quick turnaround and clear communication.
Please drop me a message before placing an order to discuss your dataset and goals so we can build exactly what you need!
Data Scientist
Languages


