I will analyze and visualise your data in pytho

L
loveyadav357
L
loveyadav357
Love Yadav

About this gig

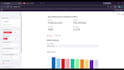
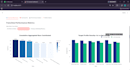
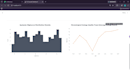
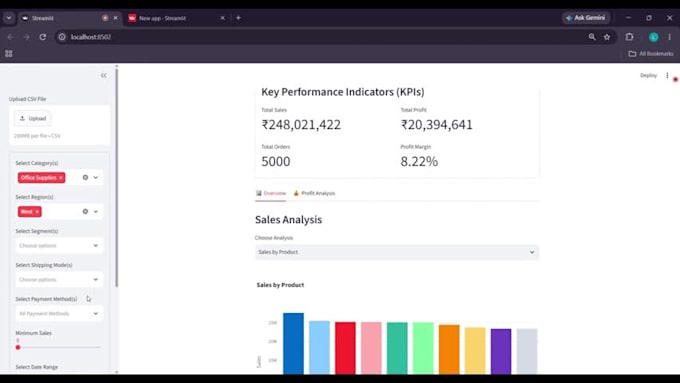
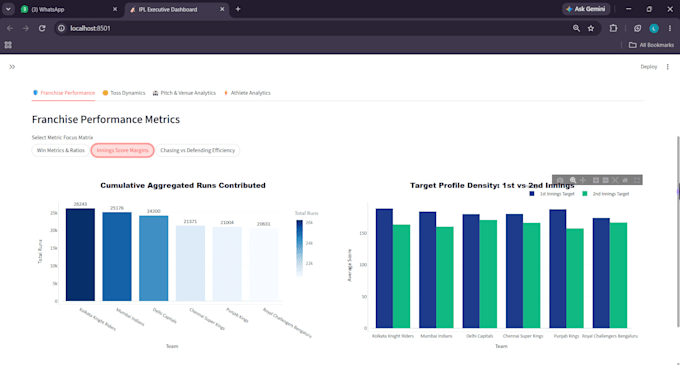
Need a clear, interactive dashboard for your data? I build Python dashboards with Streamlit and Plotly. I can prepare your CSV or Excel data with pandas and NumPy, create charts and key metrics, and add filters to help you explore results. Youll receive the dashboard source code and a brief handover. Please share your dataset and the questions you want answered so I can confirm the scope before starting.


Get to know Love Yadav

Love Yadav

Python Data Analyst, Data Cleaning and Visualization

  • FromIndia
  • Member sinceNov 2026
  • Avg. response time1 hour
  • Languages

    Hindi, English
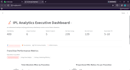
I’m a Python data analyst focused on cleaning, exploring, and visualizing data. I use pandas and NumPy to prepare datasets, then create clear charts and interactive dashboards with Plotly and Streamlit. My portfolio includes a sales dashboard, an IPL analytics dashboard with sample data, and a market-pricing demo with simulated competitor records. I’ll confirm your goals and data format before starting, then deliver organized work with a short handover