Browse categories
Explore
Fiverr Pro
English
$
USD


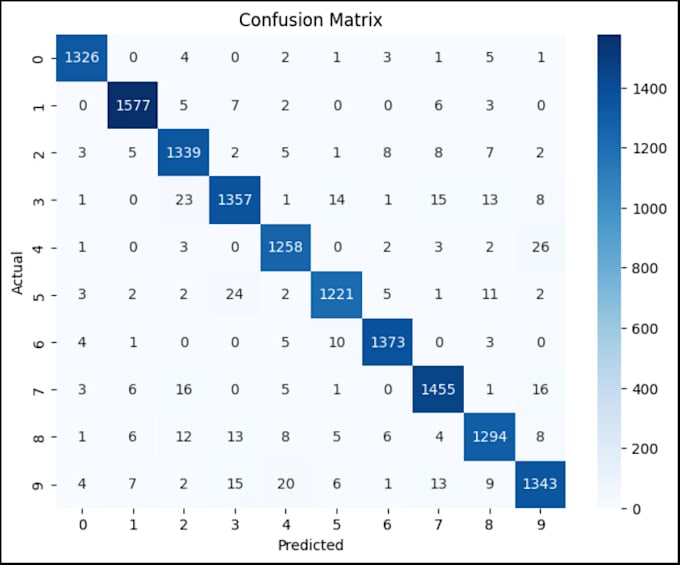
Are you looking for clear, insightful, and professional data visualizations?
I specialize in creating high-quality plots and graphs using Python, Matplotlib, and Pandas. Whether you need to visualize user activity, analyze trends, or generate statistical summaries, I can help.
My services include:
Histograms (like "Hours Spent on Social Media")
Line graphs, bar charts, scatter plots
Custom styling, labels, titles, grids
Export to high-resolution PNG/PDF
Support for Python 2.7 or 3.x environments
I also offer visualization support for research, presentations, and dashboard-ready graphics.
Let's turn your data into a story!
Message me with your dataset or problem before placing the order.
Languages