Browse categories
Explore
Fiverr Pro
English
$
USD
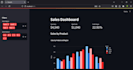
Turn Data Into Insightful Dashboards With phyton
Welcome to your one-stop solution for Streamlit dashboards!
Are you looking for a fast, interactive, and beautiful data dashboard or web app to present your data insights? You're in the right place! I specialize in creating custom Streamlit apps that bring your data to life perfect for business reports, analytics dashboards, machine learning models, and more.
What I Offer:
Interactive dashboards with filters, charts, and tables
Integration of maps, graphs (Plotly, Matplotlib, Seaborn)
Upload/download functionality (CSV, Excel, etc.)
Deployment support (Streamlit Cloud, Heroku, etc.)
Clean and professional UI with responsive layouts
Custom login/authentication (on request)
Example Use Cases:


What is Streamlit?
Streamlit is a Python framework for creating interactive web apps and dashboards quickly, with minimal code. It’s perfect for displaying data insights, charts, and reports in an easy-to-use format.
Can you integrate machine learning models into the dashboard?
Yes! I can integrate machine learning models into your Streamlit app to allow for real-time predictions and visualizations.
Can you deploy the dashboard to a live website?
Yes! I offer deployment support to platforms like Streamlit Cloud or Heroku so your dashboard can be accessed online
What kind of data do you accept?
I accept data in CSV, Excel, or Google Sheets format. If you have other data sources, feel free to contact me!
How long will it take to complete my project?
The project timeline depends on the complexity of the dashboard, but the typical delivery is between 2–7 days.


