Browse categories
Explore
Fiverr Pro
English
$
USD


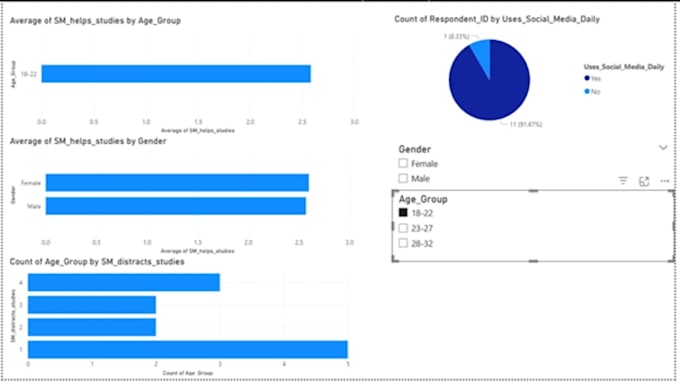
Welcome! I create clean and interactive Power BI dashboards tailored to your data.
I can transform your survey, academic, or business data into easy-to-understand visuals.
My dashboards include:
Interactive charts and graphs (bar, column, pie, line, tables)
Slicers and filters for easy exploration
Clear, professional layout and formatting
Deliverable Power BI file (.pbix) along with screenshots
I offer three packages:
Basic: Simple dashboard for small datasets
Standard: Interactive dashboard with filters and multiple pages
Premium: Advanced dashboard with multiple datasets, polished layout, and ready-to-present visuals
I focus on delivering a functional, clean, and professional dashboard, even as a beginner, so you can confidently use it for research, business, or presentations.
Power BI Dashboard Designer, Data Visualization and Analysis
Languages
What will I receive?
You will receive an interactive Power BI dashboard and the editable .pbix file, plus screenshots of the dashboard.
What data formats can you use?
I can work with Excel, CSV, or survey datasets.
How many revisions do I get?
Basic package includes 2 revisions, Standard includes 3, and Premium includes 4–5 revisions.
Can you add interactive filters/slicers?
Yes! All dashboards include interactive slicers for gender, age group, or other variables you need.
Can I use the dashboard for presentations?
Yes, the Premium package includes presentation-ready visuals (PDF/PPT export).