Browse categories
Explore
Fiverr Pro
English
$
USD
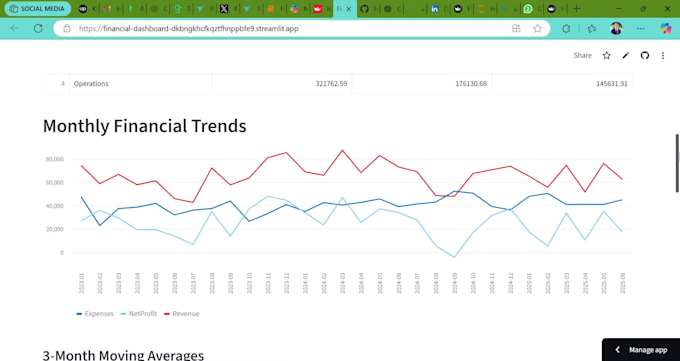
Professional Data Analysis and Insights for Smart Decisions
I will create a professional financial dashboard using Excel, Python, or Streamlit. Your raw data will be transformed into clear KPIs, charts, and summaries that help you track performance and make better decisions. Whether you need a simple Excel report or a full interactive dashboard, I deliver clean, user-friendly designs with quick turnaround.


What type of financial data do you need from me?
A: I typically work with Excel files containing trial balances, general ledgers, or monthly financial summaries. If you're unsure, I’ll guide you step-by-step.
Can I request specific KPIs or chart types?
Absolutely. You can specify which metrics or visualizations you need, and I’ll tailor the dashboard to match your goals.
Will the dashboard work online or offline?
You’ll receive both options: a hosted online version and a local version you can run on your computer.
Do I need to know Python or Streamlit to use the dashboard?
Not at all. The dashboard is user-friendly and fully interactive — no coding required.