Browse categories
Explore
Fiverr Pro
English
$
USD
data visualization dashboard, power bi dashboard, excel dashboard, data analysis, kpi reports, business analytics, performance dashboard, data reporting
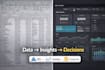
Raw data is useless if you can't understand it or act on it.
Businesses struggle with messy spreadsheets, unclear KPIs, and reports that don't answer real questions. A proper data visualization dashboard turns numbers into clear performance insights.
I create professional data dashboards, data analysis, and KPI reports using Excel and Power BI to help you track performance, identify trends, and make informed decisions. I focus on clarity, accuracy, and business relevance not just charts.
Whether you need sales, finance, operations, or marketing dashboards, I structure your data, build meaningful KPIs, and present insights in a clean, interactive format that stakeholders actually understand.
Order now and turn your data into clear, actionable dashboards that drive results.
data visualization dashboard, power bi dashboard, excel dashboard, data analysis, kpi reports, business analytics, performance dashboard, data reporting


What types of dashboards can you create?
I create interactive and professional dashboards using Excel and Power BI, including KPI tracking, performance analysis, time series, comparison charts, and business insights for sales, marketing, finance, and operations.
Can you handle large or messy datasets?
Yes. I clean, organize, and transform raw datasets so your dashboards are accurate, visually clear, and ready for actionable insights. No manual wrangling required from you.
Will my dashboard be interactive?
Absolutely. Dashboards are designed with filters, slicers, and clickable visuals so you can explore KPIs and trends dynamically without additional software.
What deliverables will I receive?
You’ll get a fully functional Excel or Power BI dashboard, visual KPIs, trend analysis, charts, and a summary of key insights.
What information do you need from me to start?
I need your dataset (Excel, CSV, Google Sheets, or database export) and a clear description of the KPIs or business questions you want to track. That’s all, I handle the rest.


