Browse categories
Explore
Fiverr Pro
English
$
USD


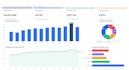

STOP DROWNING IN DATA ROWS. Does your team still manage KPIs in plain spreadsheet tables with no structure? I will build you a clean, automated, and interactive Excel Dashboard that makes your key numbers easy to read, filter, and shareno Power BI license, no coding, and no complexity.
What I deliver:
Why Excel dashboards? Not every team needs the cost of Power BI. Excel is universal, easy to share, and perfect for small businesses and managers who need clarity without the high price tag.
My Professional Background: I have designed executive-level KPI dashboards for a national bank, a real estate firm, and an energy company, tracking financial and operational metrics used in high-stakes board reviews.
Multilingual Support: I can build your dashboard and labels in Eng , Fr , Arabic
Power BI Expert , Data Analyst , Dashboard and KPI Specialist
Languages


