Browse categories
Explore
Fiverr Pro
English
$
USD
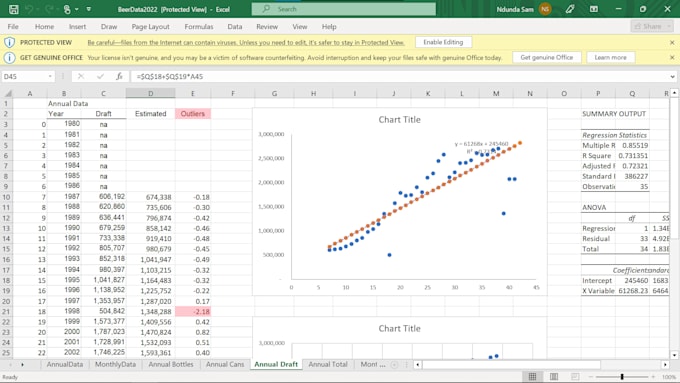
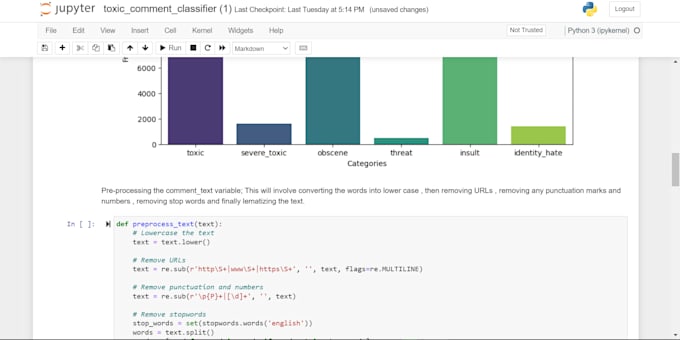
I will make interactive dashboards and perform data analysis using Power BI, R, Python, Excel, and SPSS to turn your data into clear, actionable insights. Ill help you visualize trends, run statistical tests, and make informed reports.
Share your Problem Statement and I will help you find the best solution as well as work on your project.
WHAT I OFFER
KINDLY message me before ordering to discuss your project!


| (1) | ||
| (0) | ||
| (0) | ||
| (0) | ||
| (0) |
drakoshanks

United States
I highly recommend this seller. The results exceeded my expectations💯, especially given how challenging the project was. He is highly skilled, professional, and always willing to clearly explain his work while offering the best possible solutions. I will definitely work with him again.
Up to $50
Price
4 days
Duration
| (1) | ||
| (0) | ||
| (0) | ||
| (0) | ||
| (0) |
drakoshanks
United States
I highly recommend this seller. The results exceeded my expectations💯, especially given how challenging the project was. He is highly skilled, professional, and always willing to clearly explain his work while offering the best possible solutions. I will definitely work with him again.
Up to $50
Price
4 days
Duration