Browse categories
English
$
USD
Connect to your AI
Power BI and Looker Studio Dashboards, Data Analyst, MS Statistics
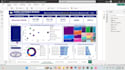
Tired of rebuilding the same Excel report every week? I'll turn your raw data into a clean, interactive Power BI dashboard that answers your key business questions at a glance.
What you get:
Good fit for: sales, finance, marketing, operations, HR, and NGO program (M&E) data.
Why me: MS in Statistics, 7+ years as a data analyst, and Power BI reporting experience on projects with WHO, UNICEF, icddr,b and Room to Read. I check every number before delivery.
How it works:
Not sure which package fits? Message me before ordering and I'll reply with a quick plan.



Can you give me a custom quote for my project?
Yes. Send me a sample of your data and your requirements, and I'll send a custom offer that fits your scope and budget.
Do you work on Direct Query datasets?
Yes. I work with Import, DirectQuery and composite models, and I'll recommend the best option for your data size and refresh needs.
Do I need Power BI Pro?
No. You can open the .pbix file in free Power BI Desktop. Pro is only needed if you want to share the report online inside your organization.
Can the dashboard update automatically?
Yes, if your data is in a cloud source such as SharePoint, Google Sheets or a SQL database. I set up the connection and explain how the refresh works.
Is my data safe with you?
Yes. Your files are used only for your project and deleted after delivery on request. I'm happy to sign an NDA.