Browse categories
Explore
Fiverr Pro
English
$
USD



Struggling to make sense of your business data?
Spending hours in spreadsheets without clear answers?
Missing growth opportunities because insights aren't visible?
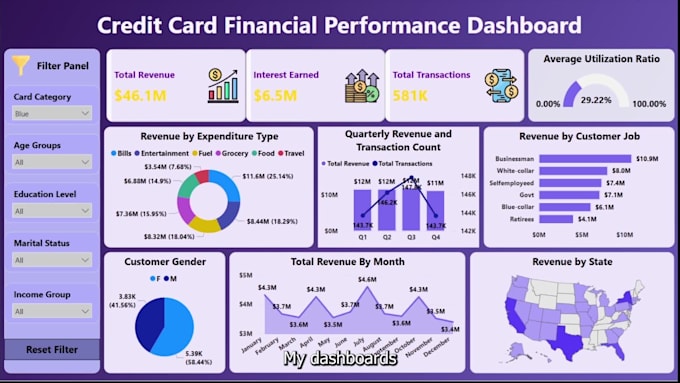
I'm here as your Data Analyst & Power BI Expert, turning your raw data into clean, interactive, and insightful dashboards that drive smarter decisions and real business results.
With 3+ years of experience in Power BI dashboards, data visualization, reports, KPIs, and custom charts, I help businesses transform scattered data into clear stories, whether its tracking performance, analyzing trends, or uncovering growth opportunities.
What I Deliver
Why Choose Me
Certified Data Analyst with proven results boosting profit margins & efficiency
Detail-oriented, reliable, and committed to client success
I don't just build dashboards, I deliver decision-making tools that drive growth, optimize operations, and keep you ahead of the competition
Professional Power BI Dashboard Developer: Data Visualization Expert
Languages
What information and resources do I need to provide for the dashboard?
To create a Power BI dashboard, I need your project goals, metrics, branding details (logo, colors, etc.), and access to your data source (Excel, CSV, SQL Server). These ensure integration and design accuracy. A clear scope will help achieve your desired results.
What will I receive in the final delivery?
You’ll receive a fully interactive Power BI dashboard in your preferred format—PBIX file, PDF, PowerPoint, or web-based version. It will include all necessary visualizations, insights, and interactivity, tailored to meet your business goals.
What types of visualizations and features do you offer?
I provide Power BI visualizations like KPI cards, heatmaps, dynamic charts, maps, and tables. Features include slicers, filters, drill-throughs, and bookmarks for interactivity. These ensure actionable insights and an engaging user experience.
Is it safe to share confidential data?
Yes! If you're concerned, you can share a sample dataset for the dashboard. I ensure strict confidentiality when working with real data, providing a secure process to protect your sensitive information. Your privacy is my priority.
Can you clean and transform raw data before creating dashboards?
Yes! I offer data cleaning and transformation services to prepare datasets for accurate visualizations. I handle messy or incomplete data to ensure your dashboard delivers actionable insights.
Can you work with non-English data?
Yes, I can work with datasets in different languages. For better accuracy, please share relevant context or translations for specific fields. This ensures the dashboard’s visualizations align with your expectations.
Do you provide after-sales support for the dashboard?
Yes! I offer 7 days of free support to help with any issues or changes to your Power BI dashboard. My goal is to ensure you’re completely satisfied with the final results.
Will I be charged for changes after the project is delivered?
Minor adjustments (up to 2) are free within 7 days. For significant modifications that require extra time or effort, we can discuss charges based on the scope of work.
Can I get a written report instead of just a dashboard?
Yes! Alongside the Power BI dashboard, I can provide a written report summarizing key insights and findings from your data. This ensures clarity and supports decision-making.