Browse categories
Explore
Fiverr Pro
English
$
USD

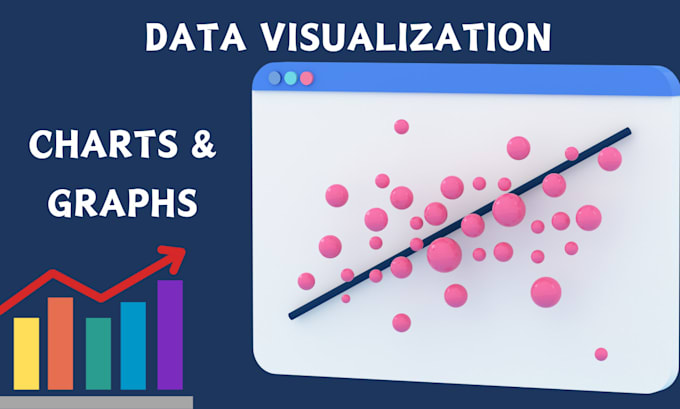
Welcome to my Data Visualization Gig!
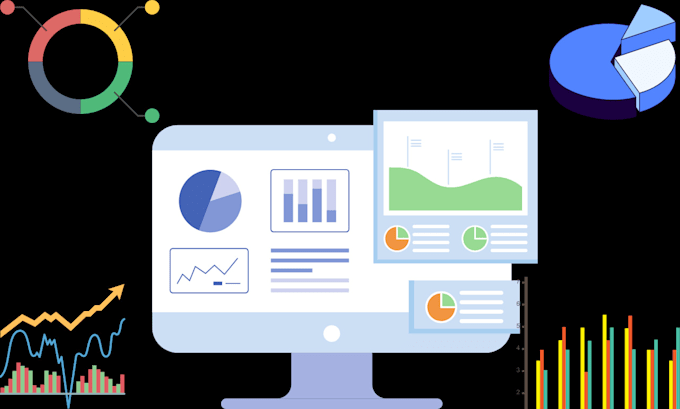
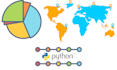
Do you have raw data that needs to be transformed into visually appealing and informative presentations? Look no further! I specialize in leveraging the power of Python's data visualization libraries to create stunning visualizations that effectively communicate your message and insights.
What I Offer:
Ready to Transform Your Data?
Order my gig today and let me help you bring your data to life! Together, we'll create visualizations that not only impress your audience but also provide valuable insights to drive your business forward.
Data Scientist
Languages
What types of data can you visualize?
I can visualize various types of data, including financial data, sales data, social media data, scientific data, and more. Whether it's structured or unstructured data, I can help you turn it into insightful visualizations.
Can you create interactive visualizations?
Absolutely! I specialize in creating interactive visualizations using Python's data visualization libraries like Matplotlib, Seaborn, Plotly, and Dash. These interactive features allow you to explore and interact with your data dynamically.