I will create interactive data visualization using flourish

M
mhamedoublal
M
mhamedoublal
Mohamed O

About this gig

Looking for professional and interactive data visualization?

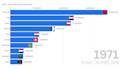
I will create amazing animated charts, bar chart race videos, and interactive data visualizations using Flourish Studio.

My services include:

  • Bar chart race animations
  • Interactive charts and graphs
  • Statistics videos for YouTube and TikTok
  • Data visualization dashboards
  • Professional and clean design

Why choose me?

  • High-quality visuals
  • Fast delivery
  • Professional communication
  • Attention to detail

I can work with Excel, CSV, and statistical data to create engaging and visually attractive content for your audience or business.

Feel free to contact me before ordering.

Get to know Mohamed O

Mohamed O
  • FromMorocco
  • Member sinceJun 2025
  • Avg. response time1 hour
  • Languages

    English, Arabic, French
Are you looking for clean, insightful, and interactive reports? You're in the right place! I specialize in building professional dashboards and data reports using Power BI and Excel, helping businesses visualize their data clearly and make smarter decisions. 🔧 What I Can Do for You: ✅ Clean and prepare your data using Power Query ✅ Design modern, responsive dashboards ✅ Connect to data from Excel, SQL, web APIs, and more ✅ Optimize your reports for clarity and fast performance ✅ Deliver complete solutions with support and guidance ✅ Guarantee full confidentiality and professionalism

Related tags