Browse categories
Explore
Fiverr Pro
English
$
USD


Hello! Im Mijan, a professional GIS and Land Survey Specialist with over 6+ years of hands-on experience in Geographic Information Systems (GIS), spatial analysis, digital mapping, and geospatial data visualization.
I specialize in delivering high-quality thematic maps, spatial analysis, land survey mapping, territory and boundary maps, land use/land cover (LULC) maps, suitability analysis, and custom GIS solutions using industry-standard tools such as ArcGIS, QGIS, Google Earth Engine (GEE), and remote sensing datasets.
Whether you need accurate cartographic maps, GIS data processing, georeferencing, shapefile creation, raster analysis, vector analysis, or professional map layouts, I ensure results that are technically sound, visually clear, and decision-ready.
I believe in creating real value for my clients through clear communication, strong attention to detail, fast turnaround time, and reliable project delivery. My goal is not just to complete tasksbut to help your project succeed.
Feel free to explore my gigsId be happy to discuss your requirements and provide a custom GIS solution tailored to your needs.
Best regards,
Mijan
Geo Mapping Solutions from GIS and REMOTE SENSING EXPERT
Languages
What kind of geospatial analyses can you perform?
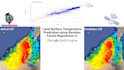
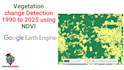
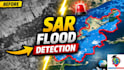
I can perform a wide range of geospatial analyses, including land use/land cover mapping, NDVI time-series analysis, rainfall and temperature trends, spatial correlation, and machine learning classification using Google Earth Engine and Jupyter Notebook
Which tools and libraries do you use?
I primarily use Python with libraries such as geopandas, rasterio, xarray, matplotlib, and earthengine-api inside Jupyter Notebook — combined with Google Earth Engine for large-scale geospatial computations.
Can you work with both raster and vector data?
Yes! I handle both raster (e.g., satellite imagery, climate grids) and vector (e.g., shapefiles, GeoJSON) data efficiently for spatial analysis and visualization.
What data sources do you use for analysis?
I use open-source datasets like NASA NEX-GDDP, MODIS, Landsat, Sentinel, and CHIRPS — or you can provide your own custom data.
Can you customize the notebook to work with my own region or dataset?
Absolutely! Just share your region of interest (ROI) or dataset, and I’ll tailor the notebook specifically for your project needs.
Do you offer visualization dashboards or just static results?
By default, I provide maps and plots within Jupyter. However, I can also create interactive visualizations using Folium, Plotly, or export results for use in web dashboards (available in premium packages).
What file formats do you deliver?
You’ll receive outputs in formats such as .ipynb (notebook), .csv, .tif, .shp, .geojson, or .png/.pdf maps depending on your request.


