Browse categories
English
$
USD
Connect to your AI


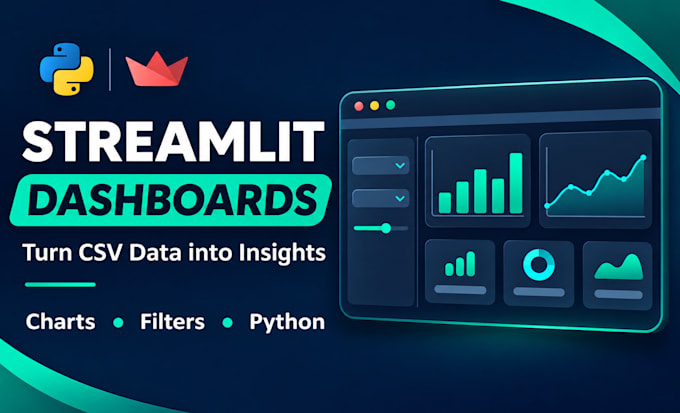
Turn your CSV data into a clear, interactive Streamlit dashboard built with Python.
The starter package includes one page, one prepared CSV dataset, up to three charts and one simple filter. You receive Python source code, a dependency list and instructions for running the app locally.
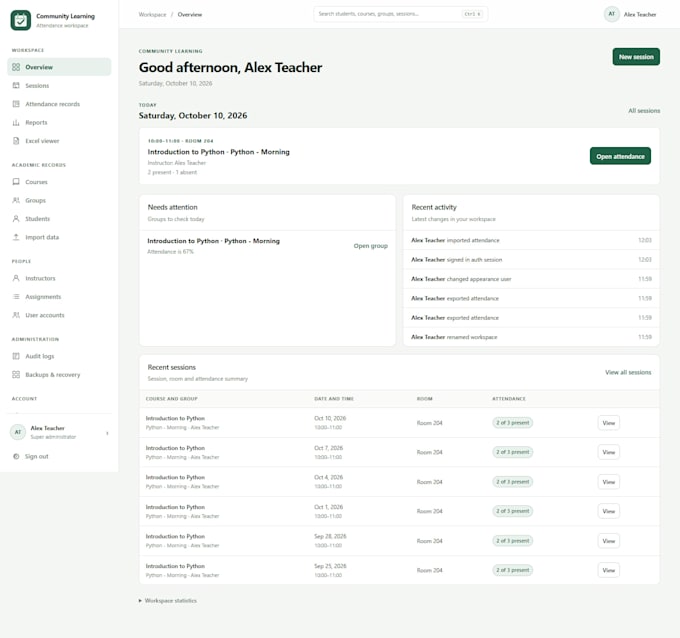
My personal Earthquake Data Explorer demonstrates maps, catalog filters, descriptive statistics and CSV export using Python, Pandas and Streamlit. Your dashboard will focus on the questions you want your data to answer.
Before ordering, send an anonymized sample CSV, the charts or metrics you need, and an example layout if you have one. We agree on the data format and dashboard behavior before work starts.
Excel inputs, additional pages, complex cleaning, live APIs or databases, deployment and ongoing hosting require a custom offer. Ongoing maintenance is not included.
Python Developer, Excel and CSV Automation, Streamlit Dashboards
Languages
What do I need to provide?
Send an anonymized CSV, the questions you want answered, and your preferred charts or metrics. The starter package uses one prepared dataset; data cleaning and Excel inputs need a separate scope check.