Browse categories
Explore
Fiverr Pro
English
$
USD


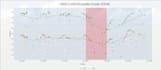
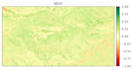
I offer high-quality, professional data visualizations, tailored to the specific needs of each client. Based on the data provided, I design clear, accurate, and visually refined graphics using programming languages such as R and Python, following visual standards commonly used in scientific papers, technical reports, and professional presentations.
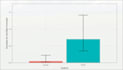
My service includes data interpretation, selection of the most appropriate chart type, and a clean, professional aesthetic adapted to the clients goals (academic publications, reports, presentations, or data communication). I can create any type of visualization, including flow charts, boxplots, bar charts, line charts, distribution and density plots, among many others, as well as combined or multi-panel figures.
Final deliverables are provided in high-resolution PNG format, meeting industry standards. If required, I also deliver editable formats such as SVG or other vector-based files. Additionally, I can include the full R or Python script, clearly documented, allowing clients to reproduce, modify, or update the visualization on their own systems.
Natural Resources Conservation Enginer, Programmer and Tech Enthusiast
Languages


