Browse categories
Explore
Fiverr Pro
English
$
USD

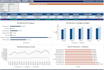


Messy sales data limits growth. As an analyst with a background in Business Administration & Marketing, I bridge the gap between complex data and strategic commercial decisions. I build automated Excel solutions designed for executives to monitor profit margins, track customer behavior, and drive revenue.
Let's elevate your BIorder today!
Data Analyst and Advanced Excel Specialist
Languages
What makes your dashboards different from technical developers?
With a background in Business Administration and Marketing, I don't just build charts. I build strategic tools. I understand commercial KPIs, profit margins, and consumer trends, ensuring your data directly supports executive decision-making.
Will I need to rebuild the dashboard when I add new sales data?
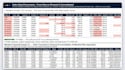
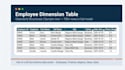
Never. The backend is 100% automated using advanced Power Query and a proper Star Schema model. You can update the entire dashboard with a single click whenever you paste new raw transaction data.
My sales data is highly confidential. How do you handle data security?
As a professional business analyst, I take data privacy seriously. I am fully open to signing a Non-Disclosure Agreement (NDA) before viewing any files, and you can always share anonymized or masked dummy data for the build phase.
Will my senior executives easily understand this dashboard?
Absolutely. I specialize in boardroom-ready presentations. Instead of overwhelming management with raw charts, the layout is designed for scanning—highlighting critical commercial KPIs, top segments, and profit trends in a clear, executive-friendly visual hierarchy.


