Browse categories
Explore
Fiverr Pro
English
$
USD

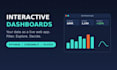
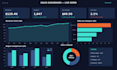
Stop sending static charts back and forth. Get a live, interactive dashboard where you can filter, explore, and understand your data in real time.
I'm a Python data developer with 1 year of hands-on experience. I build clean, fast dashboards with Streamlit and Plotly that anyone on your team can use no technical skills needed.
What your dashboard can include:
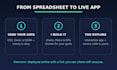
What you'll receive:
Why me: I clean and prepare your data first Clear communication, on-time delivery Honest scoping if your idea needs more than a dashboard, I'll say so upfront
Message me before ordering with a sample of your data and what you want to track I'll confirm the right package in minutes.
python developer
Languages
What do you build the dashboards with?
Streamlit and Plotly in Python — modern, fast, and the code is yours to keep.
Can people without technical skills use it?
Yes, that's the point. It works in the browser like a normal website: click, filter, explore.
Where does the dashboard live after delivery?
Basic/Standard: you get the app code with simple run instructions. Premium: I deploy it online and hand you a live link.
My data is messy. Is that a problem?
I handle reasonable cleaning as part of the build. Very messy data might need a dedicated cleaning order first — I'll tell you honestly after seeing it.


