Browse categories
Explore
Fiverr Pro
English
$
USD

Do you have data that nobody understands
because it is stuck in a spreadsheet?
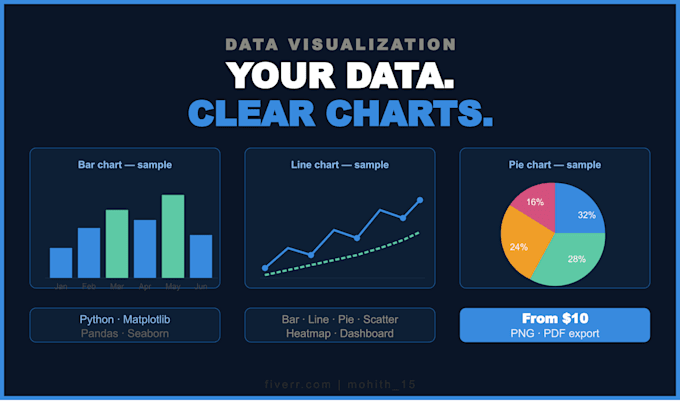
I will turn your raw data into clean,
professional charts using Python Matplotlib
ready for reports, presentations, or
business decisions.
What I will create for you:
- Bar charts, line charts, scatter plots
- Pie charts, histograms, heatmaps
- Multi-panel dashboards (subplots)
- Time series and trend charts
- Annotated charts with labels and insights
- High resolution PNG or PDF export
Tools: Python, Matplotlib, Pandas, Seaborn
Why Python Matplotlib over Power BI?
No licence needed. Total control over
colours, fonts, and layout. Perfect for
custom and publication-ready visuals.
Who is this for?
Students, researchers, small businesses,
or anyone who needs professional charts
fast no technical knowledge needed.
Not sure what chart type suits your data?
Message me first I will suggest the
best option for free!
Data Scientist Python Machine Learning AI Solutions
Languages
