Browse categories
Explore
Fiverr Pro
English
$
USD


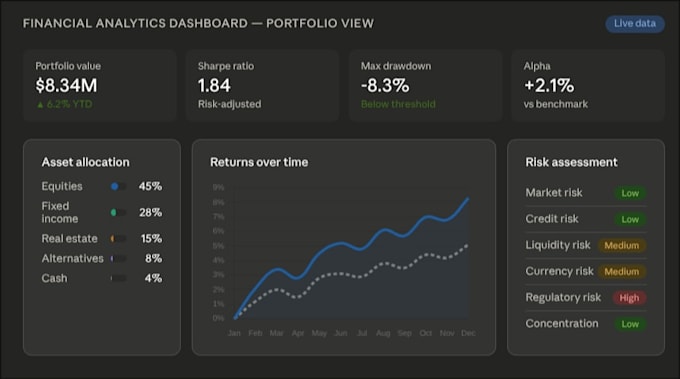
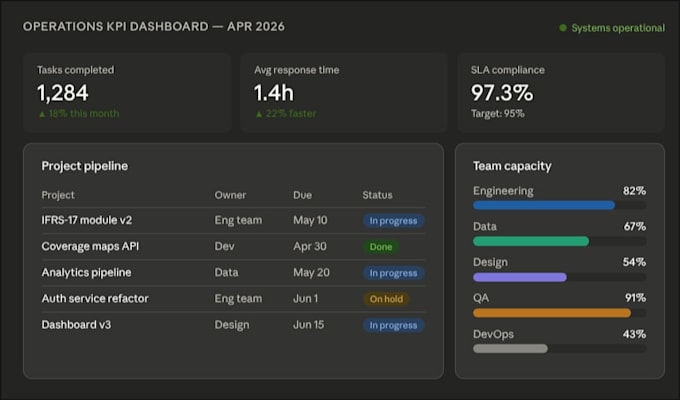
I turn raw data into clear, actionable insights combining 4+ years of engineering experience with a Master's in Quantitative Finance and Economics to deliver analytics solutions that actually drive decisions.
Whether you need an interactive dashboard, financial model, automated report, or a full data pipeline, I bring both the technical skill and financial literacy to make your data work harder for you.
What I offer:
I've built IFRS-17 actuarial reporting systems for insurance firms and quantitative finance models so I understand data not just as a developer, but as someone who knows what the numbers mean.
Full Stack Developer
Languages
Can you also use SQL to extract data
Yes I can also handle the ETL process