Browse categories
English
$
USD
Connect to your AI
Elastic SIEM engineer: detection rules, log pipelines, dashboards
Logs arriving in Elastic as one unreadable message field? Or a source with no integration at all?
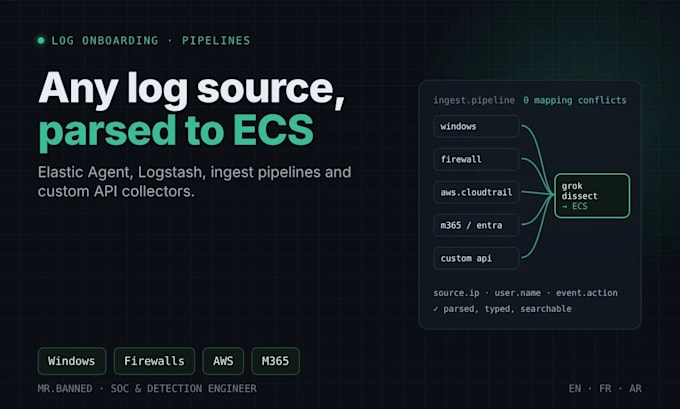
I onboard log sources into Elastic for a 24/7 SOC: Windows, Linux, firewalls, AWS, Microsoft 365, Cloudflare and web servers. I parse them properly so your dashboards and detection rules actually work.
What I do:
Sources I have onboarded: Windows event logs, Linux, firewalls, AWS CloudTrail, GuardDuty and VPC Flow Logs, Microsoft 365 and Entra ID, Cloudflare, nginx, EDR tools.
Message me with the source, a sample log line (sensitive data removed) and your Elastic version.

Destination Platform:
Other
Tools & Platforms:
Other
What access do you need?
For an audit, a Kibana user with read access to rules and alerts is enough. To deploy rules, a role that can manage detection rules. I never need superuser access.
Which rule types do you write?
KQL query, EQL sequences for multi-step correlation, threshold, new terms, ES|QL and indicator match rules. Machine learning rules need a paid Elastic subscription.
Can you write rules for a specific threat?
Yes. Send me the technique, threat report or attack scenario and the logs you collect. I tell you first whether your data can detect it.
How do you measure the false positive reduction?
I compare alert counts per rule over the same period before and after tuning, and list every change I made, so you can verify the result yourself.
Do you also work with Wazuh?
Yes: custom Wazuh rules and decoders. Message me with your use case and I'll send a custom offer.
