Browse categories
English
$
USD
Connect to your AI

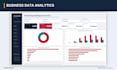


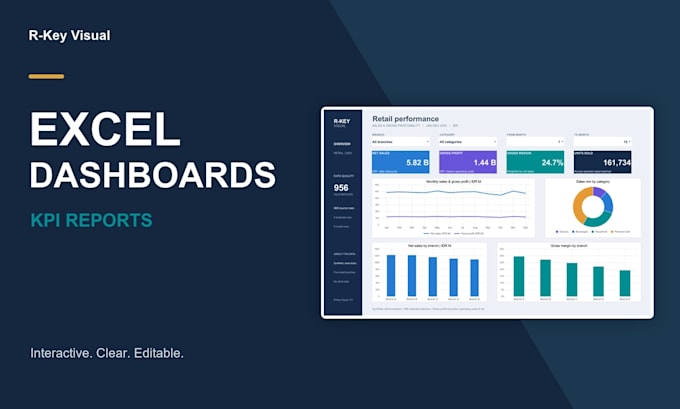
Turn your Excel or CSV data into clear, interactive dashboards that help you track performance and make informed decisions.
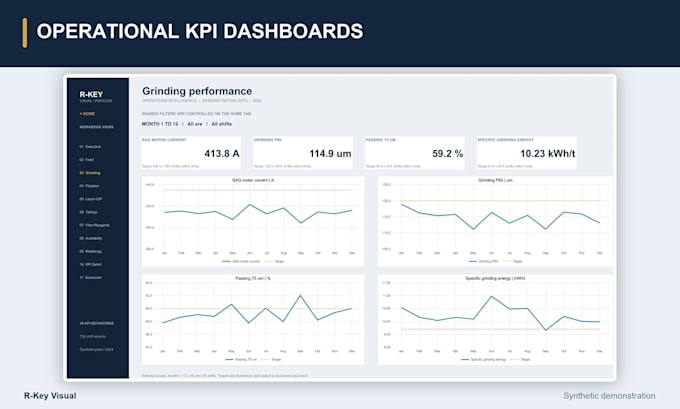
I build Excel dashboards for sales, operations and business KPIs, with readable visuals, practical filters and traceable calculations.
BASIC: 1 dashboard page, up to 5 KPIs and 4 charts using one clean data table.
STANDARD: 2 dashboard pages, up to 10 KPIs and 8 charts, basic data cleaning and interactive filters.
PREMIUM: 3 dashboard pages, up to 15 KPIs and 12 charts, basic data cleaning, filters and a written insights summary.
Standard covers up to 2 related source tables; Premium covers up to 3. Basic cleaning includes duplicates, blanks and consistent formats. Complex restructuring, external connections, VBA and web embedding require a custom quote.
You receive an editable Excel workbook. Revisions cover adjustments within the agreed scope; new data sources, KPIs or pages are additional work.
Client data is kept confidential. Portfolio examples use public or synthetic data.
Please message me with a data sample and your goals before ordering.
Data Analytics , Business Intelligence , Automation
Languages
What do you need to get started?
Your Excel or CSV files, the KPIs you want to track, preferred filters and any design references. Please provide anonymised sample data first if your information is sensitive.
What counts as a dashboard?
One dashboard means one visual reporting page within an Excel workbook. Supporting data and calculation sheets do not count as dashboard pages.
What is included in a revision?
Adjustments to layout, colours, labels or calculations within the agreed requirements. New sources, KPIs, pages or a change in project direction require an additional quote.
Will you use my data in your portfolio?
Your data and project files will not be published or used in my portfolio without your permission. Public portfolio examples use public or synthetic data.
Can you clean and organise my data?
Standard and Premium include basic cleaning, such as handling duplicates, identifying blanks and standardising formats. Missing values are not guessed. Complex restructuring or inconsistent files require a separate assessment.
Will the dashboard update when I add new data?
I can structure the workbook for updates using the agreed source layout and provide refresh instructions. Automatic connections to external systems are not included. Changes to source columns or structure may require adjustments.
Which Excel version do I need?
Please tell me your Excel version and whether you use Windows, Mac or Excel for the web before ordering. I will confirm compatibility and any feature limitations before we agree on the scope.
Can you build a dashboard specific to my industry?
Yes. I can tailor the dashboard to your business questions and agreed KPI definitions. Please share your reporting goals, calculation rules and sample data. Complex operational or industry-specific models may require a custom offer.