Browse categories
English
$
USD
Connect to your AI
Python Developer ,Web scraping and Data Analysis
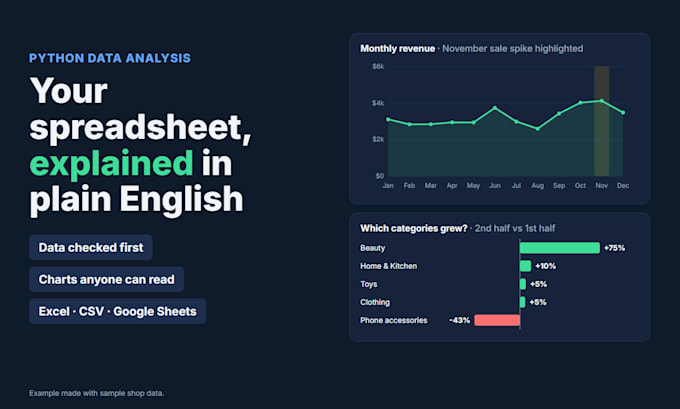
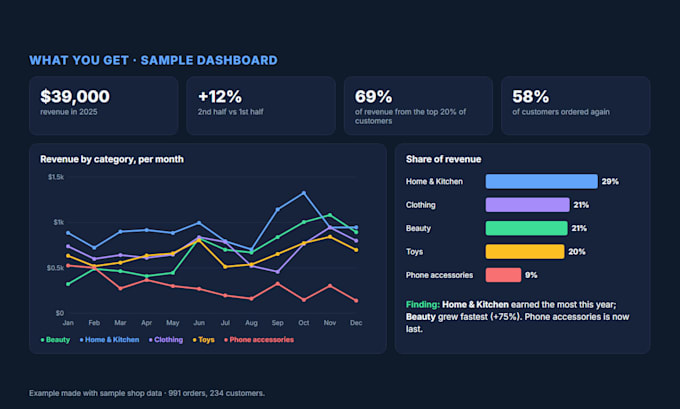
Have a spreadsheet full of numbers but no clear answers? I analyse your Excel or CSV data in Python and send back charts and a short report in plain English: what is going up, what is going down, what stands out.
Why mine are different: I check the data before I trust it. Duplicates, blanks, odd values and totals that don't add up are found first and listed in the report - nothing is quietly dropped or guessed.
You get:
Good fits: sales and order data, website or shop exports, survey results, inventory, expenses, any business spreadsheet you want explained.
Free check: send the file (or 50 rows of it) and your question, and I'll tell you what the data can and can't answer before you order.
Launch offer: my first 15 orders across all my gigs get the premium treatment, whatever package you pick.
Not for: homework, exams or graded assignments, or personal data you don't have the right to use.


What do you need from me?
The file and one or two questions you want answered ("which products are slowing down?").
Do you use SPSS or Stata?
No I work in Python (pandas). You get the same results plus code you can re-run.
My data is messy. Is that a problem?
No. Cleaning is part of the job, and the report lists every fix I made.