Browse categories
Explore
Fiverr Pro
English
$
USD
Pakistan
PDF Editor Data Cleaning Extraction Advanced Excel Specialist
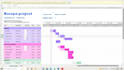
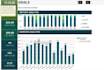
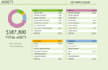
I am a specialized data professional and automation expert dedicated to transforming complex, disorganized datasets into high-impact, audit-ready financial insights. My expertise centers on end-to-end data automation and data visualization, where I leverage advanced Excel logic including Vlookup, Xlookup, and Hlookup to bridge the gap between raw data and professional reporting. I specialize in building interactive dashboards and dynamic pivot tables that allow for real-time analysis, ensuring your data formatting and data cleanup processes are both seamless and scalable. By integrating VBA macros and custom buttons and forms, I create "one-click" solutions that eliminate manual errors and streamline repetitive workflows.
Beyond standard spreadsheet management, I bring deep expertise in Power BI to provide sophisticated data visualization for those requiring high-level business intelligence. Whether you need a high-precision PDF to Excel conversion of a complex wealth statement or a fully automated reporting engine with professional charts and graphs.
"Please contact me before ordering so I can see your data structure and confirm if your requirements are technically feasible!"


Platform:
Excel
•
Power BI
•
VBA
Development technology:
Power Query
•
Power BI
•
VLOOKUP
Expertise:
Pivot tables
•
Formulas
•
Macros
•
Dashboard
•
Charts
Can you handle messy or low-quality scanned PDF documents?
Absolutely. I specialize in high-precision data extraction from difficult, disorganized, or poorly scanned files. I manually verify figures and use advanced data cleanup techniques to ensure your final Excel or Word document is 100% accurate and audit-ready.
What is the difference between a Pivot Table and a Dashboard?
A Pivot Table is a powerful tool used to summarize and reorganize large datasets instantly. A Dashboard is a visual interface that uses those tables, along with interactive charts, graphs, and slicers, to give you a "big picture" view of your business performance.
Can you automate a report that I have to update manually every week?
Absolutely! I can set up Macros (VBA) or use Power Query so that you can simply paste your new data and click "Refresh" to update all your calculations, tables, and charts instantly.
o I need to have a specific version of Excel for the dashboard to work?
Most features work across all versions, but some advanced tools (like certain Slicers or Power Query features) work best on Excel 2016 or later, including Office 365. Please let me know which version you are using so I can ensure full compatibility.
Can you create a dashboard that pulls data from multiple different files?
Yes. I can use Power Query to link and consolidate data from various Excel workbooks, CSV files, or folders into one master dashboard for a "big picture" view.
Can you fix formulas in my existing sheet that are showing errors?
Yes! If you have a "broken" file, I can perform a full audit to find the errors (like #REF! or #VALUE!), optimize the formulas to make the file run faster, and clean up the structure.
How do I share my data with you securely?
You can upload your file directly to the Fiverr order page. If the file is too large, we can use a secure cloud link. Rest assured, your data is handled with strict confidentiality and is used solely for the completion of your project.
What if I need to add more data or features later on?
I build my Excel tools to be scalable. However, if you need significant changes after the order is closed, I’m always available for a follow-up consultation or a small custom offer to update the file for you.
Will your Macros work on a Mac?
Excel for Mac has limited VBA support compared to Windows. If you are a Mac user, please mention this upfront so I can use formulas or compatible scripts to ensure the file works perfectly on your system.


