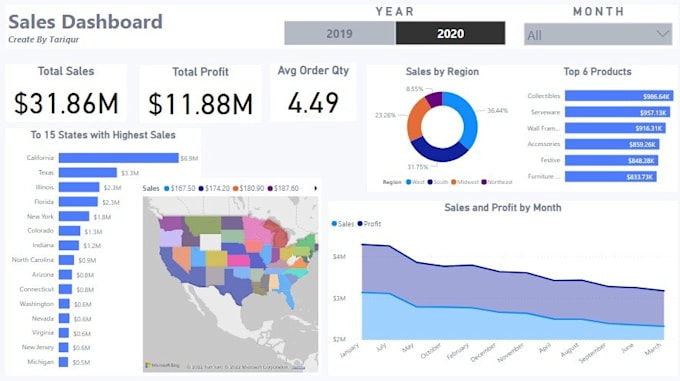
My work is to research and explore data to extract insights for you, I will do EDA (Exploratory Data Analysis) for your data set in Python & R programming language, analyze data, solve problems, and make your life easier with interactive visualization (graphs & charts).
Steps, I follow in Exploratory Data Analysis are:
- Data exploration, including features and dimensions of data.
- Data pre-processing to handle the missing and null values, dealing with outliers, and type conversion wherever necessary in the dataset.
- EDA (Univariate): including charts, graphs, histograms, box plots, etc.
- EDA (Bivariate): including scatter plots, bar charts, line charts, etc.
- EDA (Multivariate): including correlation matrix, heat maps, etc.
Tools /Technologies:
- Python
- Numpy
- Pandas
- Seaborn
- Matplotlib
- Plotly
- R-Studio
- Excel
- Tableau
- PowerBI
What you will get?
- Python notebook with proper comments.
- Source file.
My motive:
- I love telling stories that matter. I do this by finding, analyzing, and communicating insights from complex data.
I will assure you
- 100% quality work
- On-time delivery