Browse categories
Explore
Fiverr Pro
English
$
USD
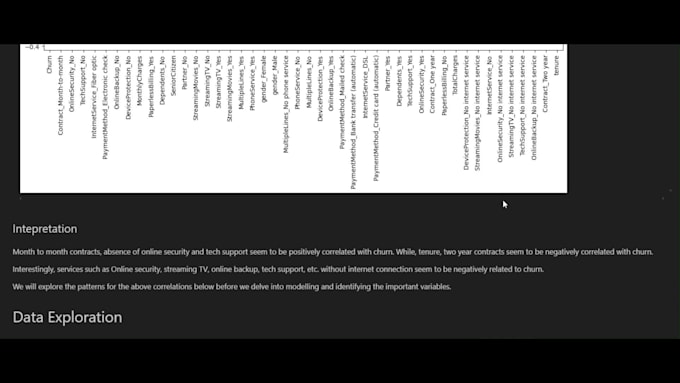
Looking to turn your data into meaningful insights? I help you analyze, understand, and visualize your data using Python and Power BI.
I specialize in Exploratory Data Analysis (EDA) to uncover trends, patterns, and actionable insights. Whether it's a dataset for a project, business, or research, Ill provide clean analysis and clear visualizations to support better decision-making.
Tools & Technologies:
Services include:
I focus on delivering insights that are not just accuratebut also easy to understand and use.
Note: Power BI services are available in Standard and Premium packages.


What kind of data can you work with?
I can work with CSV, Excel, SQL datasets and more structured or semi-structured data.
What is included in your data analysis service?
I provide data cleaning, EDA, insights, and visualizations to help you understand patterns and trends.
Which tools do you use?
I use Python (Pandas, NumPy) for analysis and Matplotlib, Seaborn, Plotly for visualization. For dashboards, I use Power BI.
Will I get a Power BI dashboard?
Yes, if you select Standard or Premium packages, I will create a fully interactive Power BI dashboard.
Do you handle messy or unclean data?
Yes, I specialize in data cleaning and preprocessing, which is a critical part of analysis.