Browse categories
English
$
USD
Connect to your AI

_gxehan.jpg)
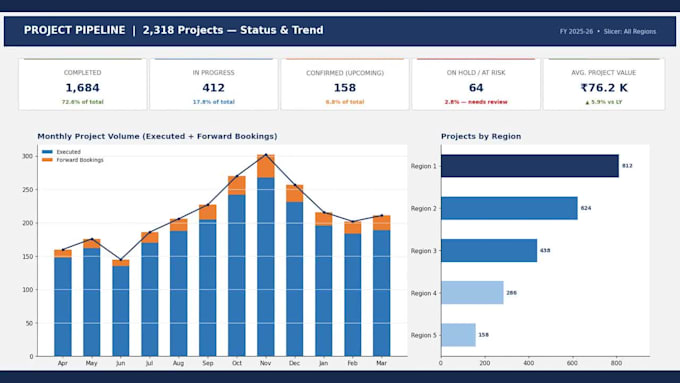
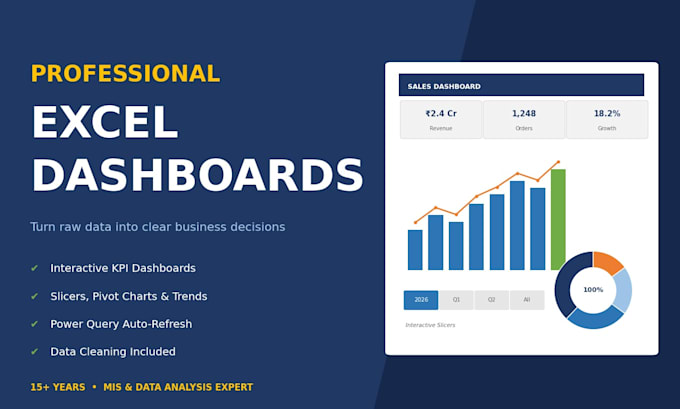
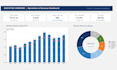
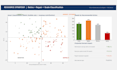
Tired of preparing the same report every week? I will turn your raw data into an interactive Excel dashboard that refreshes in one click.
You get:
Good for: sales and revenue, operations, inventory, project pipelines, expenses and management reviews.
Why me:
Send me a sample of your data before ordering and I will recommend the right package. I usually reply within the hour.
Google Sheets Automation Expert, Apps Script, Excel VBA, Dashboards
Languages
1. What format should my data be in?
Excel (.xlsx), CSV, or Google Sheets export. Don't worry if it's messy — data cleaning is included. If your data is in PDFs or images, message me first and I'll confirm feasibility.
Will I be able to update the dashboard myself with new data?
Yes! With Standard and Premium packages, I build it with Power Query — just paste your new data (or replace the source file) and click Refresh. No formulas needed. I'll include simple instructions.
Is my business data kept confidential?
Absolutely. Your data is used only to build your dashboard and deleted after delivery. I'm happy to sign an NDA, or you can send anonymized/sample data and replace it yourself later.
Which Excel version do I need?
Excel 2016 or later (Microsoft 365 recommended) for full interactivity. If you use an older version or Google Sheets, message me first — I'll suggest the best approach.
How many charts/KPIs are included?
Basic: up to 4 charts + 3 KPI cards on one sheet. Standard and Premium: more charts, multiple views, slicers, and trend analysis. If you have a specific layout in mind, share it and I'll match it.
Can you work with large datasets?
Yes — I regularly handle datasets with thousands of rows and 20+ columns. For very large files (100K+ rows), message me first so I can recommend the right structure for fast performance.