Browse categories
Explore
Fiverr Pro
English
$
USD

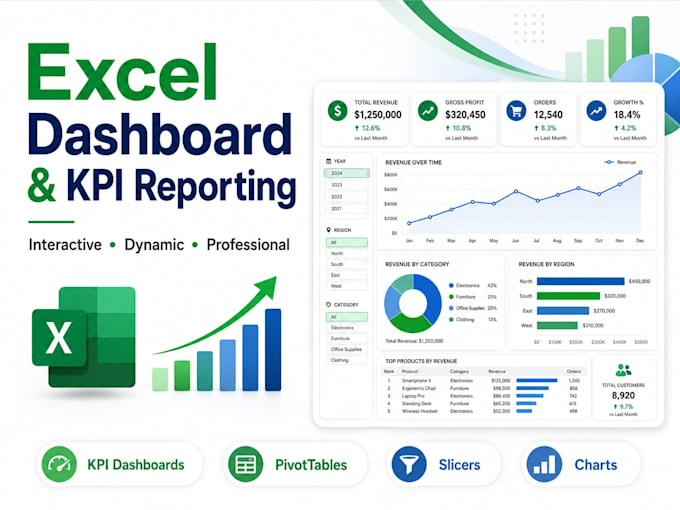

Turn your business data into a clear, professional, and interactive Excel dashboard that makes performance easy to understand.
I can create custom Excel dashboards for sales, finance, operations, marketing, inventory, projects, or other business reporting needs.
Depending on your package, your dashboard can include:
I focus on building dashboards that are not only visually clean but also practical and easy to use.
You will receive an organized Excel workbook designed around your data, KPIs, and reporting goals.
For multiple files, complex datasets, recurring reports, or advanced data-source connections, please contact me before ordering so I can recommend the right package or create a custom offer.
Data Analyst, Excel, Power BI and Survey Analysis
Languages
What do you need from me to create the Excel dashboard?
Please provide your Excel, CSV, or Google Sheets data, the KPIs or metrics you want to track, and any preferred layout or reporting style. If you are unsure which KPIs to use, I can help structure them based on your goals.
Can you clean my data before building the dashboard?
Yes. Standard and Premium packages can include data cleaning, formatting, duplicate checks, standardization, and preparation before dashboard development.
Will the dashboard be interactive?
Yes, for Standard and Premium packages. I can use slicers, filters, PivotTables, PivotCharts, and dynamic formulas so you can explore the data interactively.
Can you create dashboards for any type of business data?
Yes. I can work with sales, finance, operations, inventory, marketing, project tracking, HR, customer, and other structured business datasets.
Can the dashboard update when I add new data?
Yes, depending on how your data is structured. I can design refreshable reporting workflows using Excel tables, PivotTables, formulas, and Power Query where appropriate.
Can you combine data from multiple Excel files or sheets?
Yes. Multiple files or worksheets can be combined when their structures are compatible. Please contact me before ordering if you have several files or complex data sources.
Do you provide Power BI dashboards in this Gig?
No. This Gig is specifically for Microsoft Excel dashboards. If you need Power BI, please contact me separately.
Can you match an existing dashboard design or company reporting format?
Yes. If you have an existing report, screenshot, template, or brand guideline, send it with your order and I can follow the style as closely as practical.
What if my dataset is larger than the package limit?
Please message me with the approximate number of rows, files, and required dashboard features. I can provide a custom offer for larger or more complex projects.
Will I receive the editable Excel file?
Yes. You will receive the completed Excel workbook so you can continue using and updating the dashboard after delivery.
