Browse categories
English
$
USD
Connect to your AI

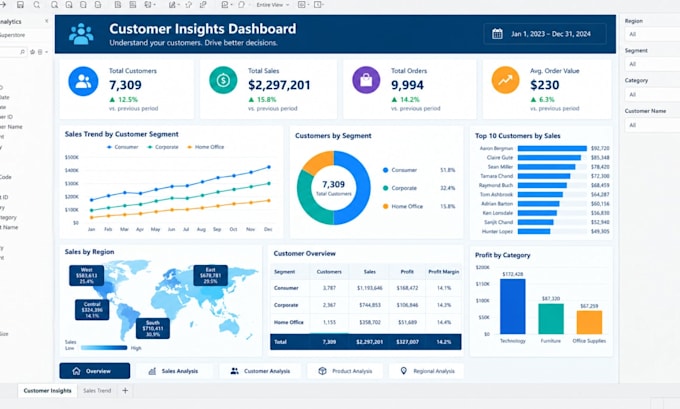
Good data visualization should make an important trend or number easier to notice, understand and discuss without forcing your audience to work through complicated spreadsheets first
WHAT I CREATE
INTERACTIVE FEATURES
IDEAL FOR
Startups, small businesses, marketing teams, sales teams, agencies, managers and anyone who needs a clearer way to present business data
WHAT I NEED FROM YOU
Your Excel, CSV, Google Sheets or other available data source, the metrics you want to monitor and any preferred layout, branding or reference dashboard
I'll turn the numbers into a dashboard that feels clear, purposeful and easy to explorerd
Turning Raw Data Into Clear Insights With Smart, Automated Dashboards
Languages
What types of dashboards can you create using Tableau and Looker Studio?
I can create sales, marketing, finance, operations, inventory, and performance dashboards, with charts, KPIs, filters, and visual summaries tailored to your business needs.
What is the difference between Tableau and Looker Studio?
Tableau is a powerful analytics platform for exploring complex datasets and building interactive visualizations. Looker Studio is commonly used for shareable reports, especially marketing and web analytics. The best option depends on your needs.
Can you connect my dashboard to multiple data sources?
Yes. I can help connect supported sources such as Excel, CSV, Google Sheets, databases, and marketing platforms. Available connections depend on the tool, connector, account permissions, and data structure.
Can you visualize my Google Analytics or Google Ads data
Yes. I can build reports using supported Google Analytics and Google Ads connections, helping you track traffic, conversions, campaign performance, engagement, and other relevant metrics.
Can you clean and organize my data before creating the dashboard?
Yes. I can help prepare your data by addressing duplicates, inconsistent formats, missing values, and unsuitable data structures. The available cleaning methods depend on the source and project scope.
