Browse categories
Explore
Fiverr Pro
English
$
USD




Your business data is sitting in rows and columns nobody reads at a glance. Getting a clear picture means hours of manual work every week. I build Excel dashboards that turn your numbers into one clean, interactive file - open it and immediately know where your business stands.
What you get:
For small business owners, e-commerce sellers, retail managers, and finance teams who track performance in Excel but can't extract clear answers fast enough.
My Olist E-Commerce Excel Dashboard analyzed 100,942 real orders - tracking seasonal trends, regional revenue, and delivery gaps across 5 KPIs. Every dashboard I deliver is one you'll actually open and use.
Message me before ordering to confirm your data is compatible.
Data Analyst, Excel, Power BI, Python and SQL
Languages
What data formats and industries do you work with?
Any structured Excel (.xlsx) or CSV file. I've worked with e-commerce, retail, automotive, HR, and finance data. Send me a brief description or sample of your data before ordering and I'll confirm it's a fit - usually within a few hours.
Do I need any special software or subscription?
No. The dashboard runs entirely in Microsoft Excel - no plugins, no Power BI license, no add-ons required. If you have Excel 2016 or later (including Microsoft 365), you're ready.
Can I update the data myself after delivery?
es - that's the whole point. The dashboard is built so you paste new data into the source sheet and every chart, KPI, and visual updates automatically. No formulas to touch, no charts to rebuild.
What if my data is messy or inconsistent?
Light cleaning and formatting is included in all packages. If your file has major issues - severely merged cells, multiple misaligned sheets, or mixed formats - let me know upfront with a sample so I can scope it honestly and price it fairly.
How do I know which package is right for me?
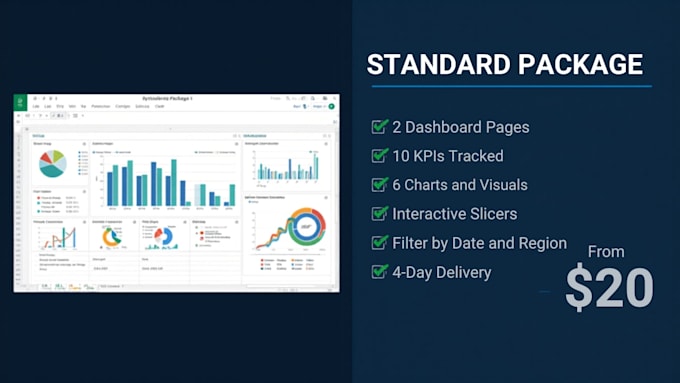
Basic is for a focused single-page overview with 5 KPIs and 3 charts - good for simple reporting. Standard adds a second page, 10 KPIs, and 6 charts with slicers for filtering - best for most businesses. Premium is a full analytical suite with unlimited KPIs, an insight summary section, and a layout