Browse categories
Explore
Fiverr Pro
English
$
USD
Losing customers quietly costs more than most businesses realize. I'll build
a custom churn prediction model that identifies which customers are likely
to leave before they do packaged in an easy-to-use interactive dashboard,
not just a static script.
What you get:
Data cleaning & preprocessing of your customer data
Model comparison: Logistic Regression vs XGBoost, so you get the
best-performing approach for your data
Feature importance analysis understand WHY customers churn, not just who
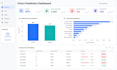
Interactive Streamlit dashboard with two modes: bulk CSV upload for batch
predictions, and a manual form for single-customer lookups
Optional: fully deployed, shareable dashboard link + retraining instructions
This is a complete, tested pipeline I've already built end-to-end dual-model
comparison, working dashboard UI, and a downloadable pre-trained model not
a theoretical demo.
Perfect for: subscription businesses, SaaS products, telecom, e-commerce,
membership platforms anywhere retention matters.
Send me your customer dataset (CSV with historical churn labels) and I'll get
started. Message me first if you're unsure which package fits your needs.


Expertise:
Classification
•
Churn
•
Predictive analysis
Programming language:
Python
•
SQL
•
Colab
Frameworks:
Scikit-learn
•
Other
Tools:
Jupyter Notebook
•
Colab
Q: What data do I need to provide?
A: A CSV with customer features (e.g., tenure, usage, plan type, support tickets) and a column indicating past churn (yes/no). More history generally means better accuracy.
Q: Can I retrain the model on new data later?
A: Yes — Premium includes clear retraining instructions so you can update the model as your data grows.
Q: Is the dashboard hosted online, or do I run it locally?
A: Premium includes a hosted, shareable dashboard link. Basic and Standard include the files to run locally on your machine.
Q: Which model performs better, Logistic Regression or XGBoost?
A: It depends on your data — that's exactly why Standard and Premium include a side-by-side comparison so you can see real performance differences before deciding.


