Browse categories
Explore
Fiverr Pro
English
$
USD


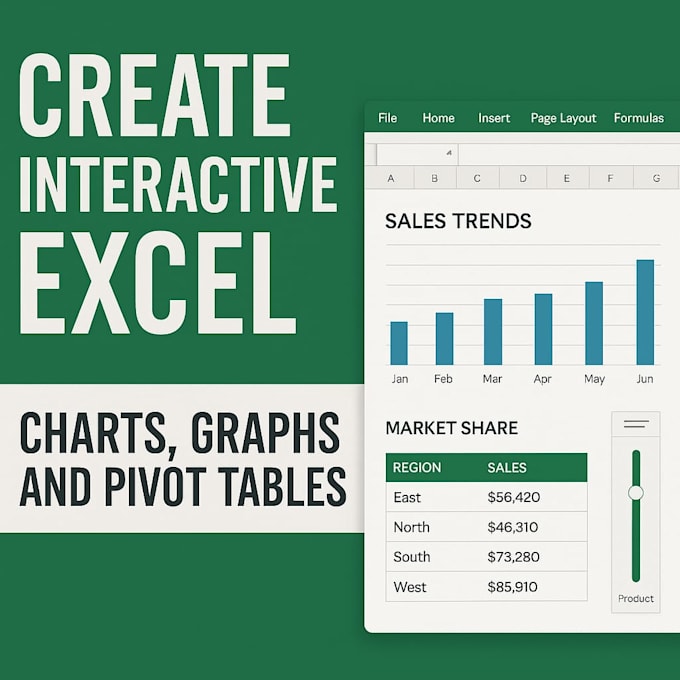
Transform Your Data into Clear, Impactful Visuals
I design custom Excel-based visual charts, graphs, and pivot tables to help you understand and present data more effectively. Whether you're reporting sales, analyzing trends, or preparing a business dashboard, I've got you covered.
What I Offer:
Why Choose Me?
Need help with a custom Excel project? Message me before placing your order so I can guide you to the right package.
Let's bring your data to life with clean, interactive visuals!
Excel Dashboards, Power Query, Data Cleaning and Reporting
Languages
What do I need to provide before placing an order?
Please share your raw data and let me know your reporting goals or visual preferences. Screenshots or sample outputs are helpful too.
Can you work with large datasets?
Yes, I can handle large datasets efficiently. For very large or complex files, please message me first for a custom quote.
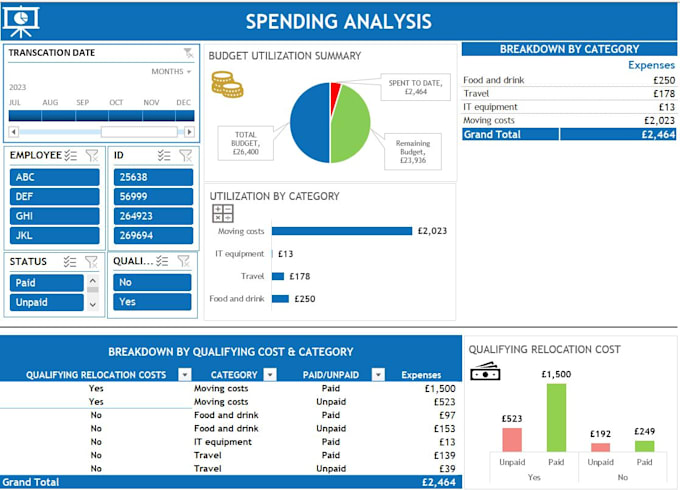
Will the charts and visuals be interactive?
Yes! I create dynamic visuals using slicers, drop-downs, and pivot interactivity. They update automatically as your data changes.
Do you use any macros or VBA?
No, I don’t use macros or VBA in this gig to ensure maximum compatibility and security across devices.
Can I request custom visuals or branding?
Absolutely. I can align visuals with your brand colors, style, or layout preferences. Just mention this while ordering.
What if I’m not sure which package to choose?
No problem! Just send me a message with your requirements. I’ll guide you to the right package or suggest a custom offer.