Browse categories
Explore
Fiverr Pro
English
$
USD


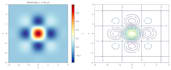
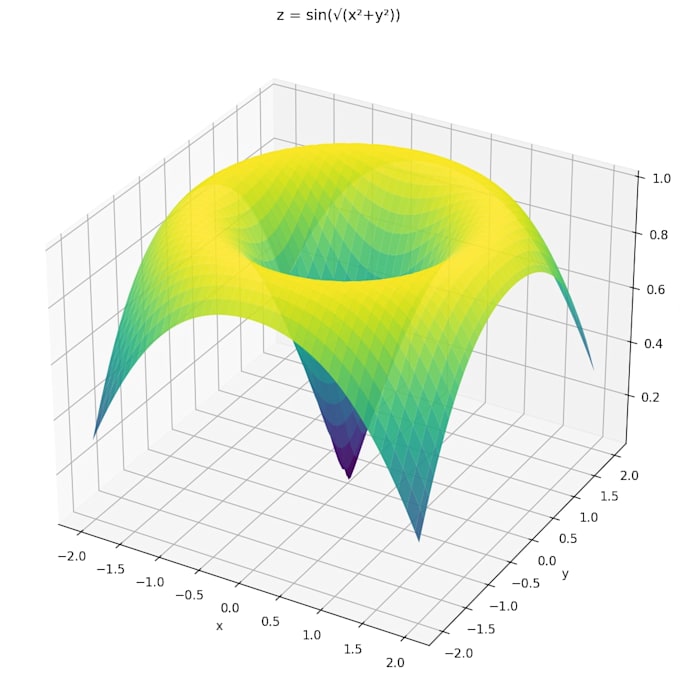
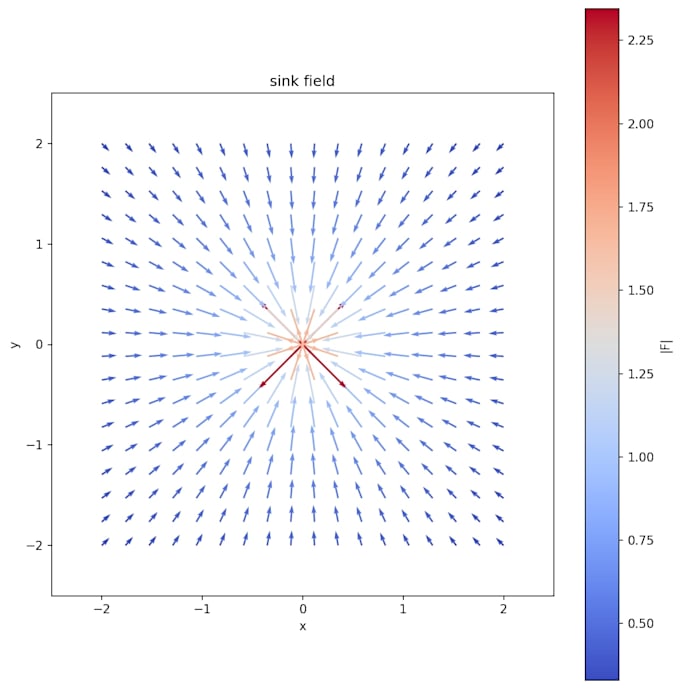
I will create clean, professional, and publication-ready scientific plots for your data using Python.
This gig is ideal if you need clear figures for:
I focus on plots that are accurate, readable, and visually clean not just generic charts.
I can help with:
What you will receive:
Tools:
This gig is best for technical, scientific, academic, or engineering data.
If you want clear and professional figures that look serious and well-structured, I would be glad to help.
Computer Engineer
Languages
What kind of data can you plot?
I work best with structured numerical data such as CSV, Excel tables, experimental results, measurements, or processed datasets.
Can you improve an existing plot?
Yes. I can recreate or improve plots that are unclear, outdated, or not visually consistent.
Will I get the Python code?
Yes, in Standard and Premium packages. It can also be added to Basic if needed.
Which file formats do you provide?
I can provide PNG, PDF, and SVG, depending on your needs.
Is this suitable for papers and theses?
Yes. This gig is designed especially for scientific, technical, and academic figures.