Browse categories
English
$
USD
Connect to your AI

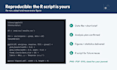
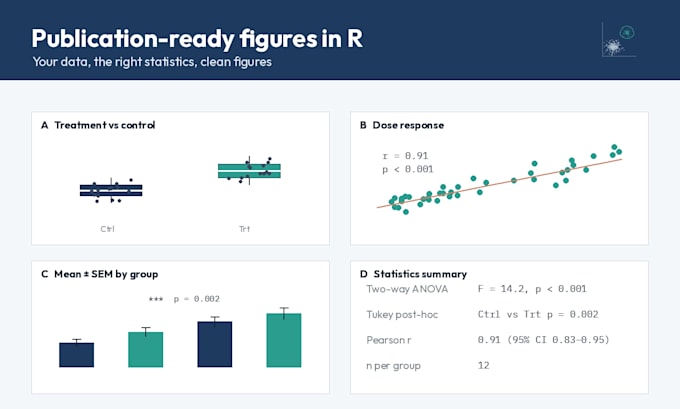
Turn your experimental or survey data into clear, publication-ready charts with the right statistics behind them.
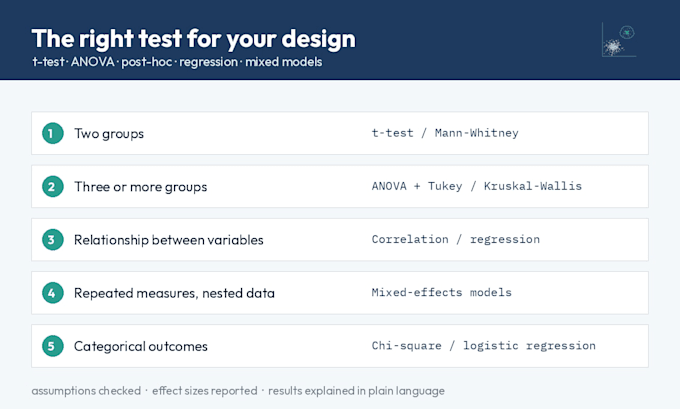
I am a PhD scientist with years of experience analysing laboratory data in R. I choose the statistical test that fits your design, run it correctly and present the result in figures that reviewers, supervisors and clients understand at a glance.
What you get:
You send the data and tell me the comparisons you need; I confirm the approach before starting. I only analyse the data you provide, exactly as provided.
Biochemist PhD in Chemical Sciences Immunology
Languages
What data format do you need?
Excel or CSV, one row per observation, with a short note on what each column means. Google Sheets exports are fine too.
Do you make up or adjust data?
No. I only analyse the data you provide, exactly as provided. I can follow a journal's figure guidelines if you send them.