Browse categories
Explore
Fiverr Pro
English
$
USD

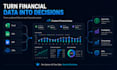

Need a custom financial app built around your business data?
I build interactive financial analytics applications that turn Excel files, CSVs, databases, ERP exports or APIs into clear and actionable financial insights.
Your app can include:
I focus first on understanding your business, workflow and the decisions the app needs to support. The solution is then built around your real requirements.
Not just charts a financial tool built around your business.
Technologies may include Python, SQL, FastAPI, PostgreSQL, APIs and modern web technologies.
Please contact me before ordering, especially for integrations, forecasting or complex applications.
Python Developer Streamlit and Business Data Apps
Languages
1. Do I need to contact you before placing an order?
Yes, I strongly recommend contacting me before ordering. Every financial application is different, so I will first review your goals, data sources and required features to make sure you choose the right package.
2. What financial data can you work with?
I can work with Excel files, CSVs, database data, ERP or accounting exports, APIs and other structured business data. If you are unsure whether your data can be used, send me a sample and I will review it.
3. Which financial metrics can you include?
The app can include revenue, expenses, gross profit, net profit, margins, cash flow, financial ratios, budget vs. actual, accounts receivable, customer or product profitability, trends and other custom KPIs relevant to your business.
4. Will I receive the source code?
Yes, source code can be included depending on the selected package and project scope. If this is important for your project, please mention it before ordering.
5. What does financial forecasting include?
Forecasting can include revenue, expenses, cash flow or other financial variables using historical data and assumptions. The exact methodology depends on your available data and business requirements.
6. Is deployment included?
Basic deployment may be included depending on the package. Advanced deployment, database configuration, custom domains or production environments can be added as an extra or custom offer.
7. Can you connect the app to an API or database?
Yes. I can connect the application to databases or external APIs when technically available. Please contact me first so I can review the documentation and integration requirements.
8. Is my financial information confidential?
Yes. Your business and financial information will be treated as confidential and used only for the development of your project. You can also provide anonymized or sample data during the initial discussion.
9. Can you clean and organize my financial data?
Yes. Data cleaning, transformation and organization can be included. I can consolidate multiple files, standardize fields, correct formatting issues and prepare your data for analysis.
10. Does this service include financial or tax advice?
No. This service provides financial data analysis, visualization and software development. It does not replace professional accounting, tax, investment or financial advice.


