Browse categories
Explore
Fiverr Pro
English
$
USD


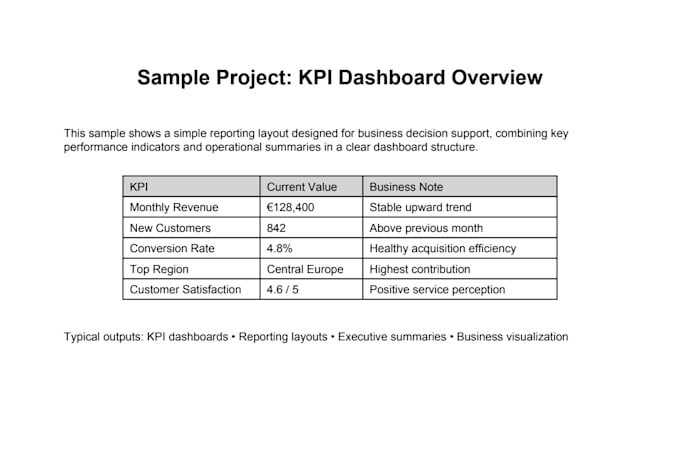
I will create clear dashboards and reports that help you understand performance, trends, and key business metrics.
This service is suitable for sales, operations, marketing, finance, customer, survey, and general business reporting needs. I focus on usability, clarity, and decision-support instead of cluttered visuals.
What I can create:
Typical dashboard elements:
Why work with me:
Please contact me before ordering if you need a larger multi-page dashboard or custom reporting logic.
AI Automation, Data Analysis and Workflow Optimization Expert
Languages
Do you build Power BI dashboards?
I can design dashboard structures and reporting logic aligned with Power BI-style business reporting. If you want, this can later be narrowed to a stricter Power BI-focused gig.
Can you use Excel as well?
Yes. Excel-based reports are also possible.
Will the dashboard be business-friendly?
Yes. I prioritize clarity, KPI structure, and decision support.
Can you redesign an existing messy report?
Yes. I can simplify and improve existing reports.
Do you also interpret the visuals?
Yes. I can add concise insight notes where needed.