Do you need high-quality TGA & DTG graphs for your research paper?
Stop struggling with Excel. I will transform your raw thermal data into professional, scientifically accurate figures using OriginPro.
I specialize in:
- TGA Curves: Clear Weight Loss (%) visualization.
- DTG (Derivative): Calculated numerically to pinpoint max degradation rates
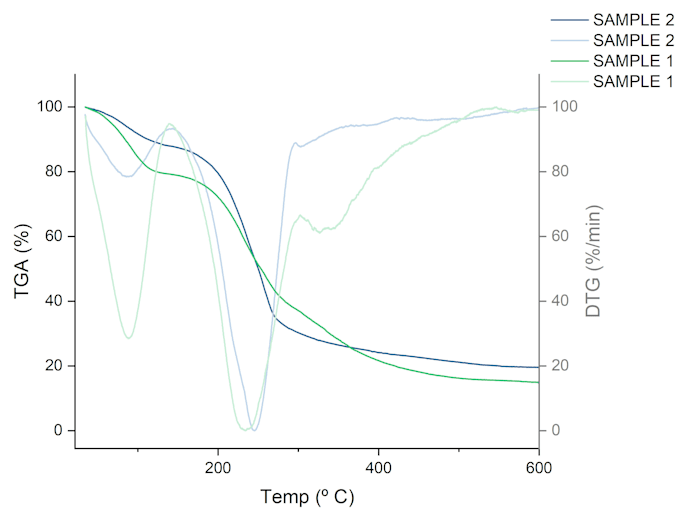
- Dual-Axis Plots: Overlaying TGA (Left Axis) and DTG (Right Axis) perfectly on the same graph.
- Key Analysis: Marking Onset Temperature, Residual Mass, and decomposition steps.
- Comparison: Beautiful stacked plots for multiple samples.
Why choose this Gig?
- Scientific Background: I understand thermal kinetics, not just design.
- Data Integrity: Proper smoothing (Savitzky-Golay) to reduce noise without altering results.
- Publication Ready: High-Resolution export (TIFF/PNG 300-600dpi) tailored to your target journal.
Requirements:
Simply send your raw data (.txt, .csv, .xls) and I will handle the rest.
Let's make your data shine. Please message me before ordering to discuss your specific analysis needs!