Browse categories
English
$
USD
Connect to your AI
Expert Data Analyst: Turning Data into Insights or Academic Excellence
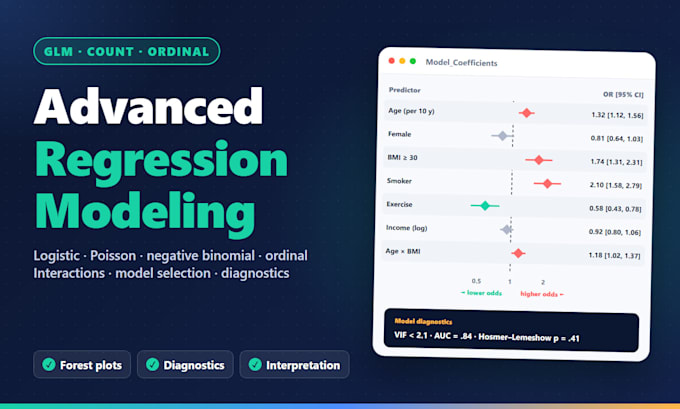
Binary, count or ordinal outcome? Ordinary linear regression gives wrong answers. Ill fit the model your data actually needs and explain what it means.
With a background in physics, mathematics and statistics, I build regression models for researchers in health, social science and business using R, SPSS or Stata.
What you get:
Scope depends on package, see the comparison table.
Not sure which model fits? Message me with your outcome variable and research question.
Need mediation, moderation or ANOVA? See my other gigs.
Which regression model do I need?
It depends on your outcome: linear for continuous, logistic for binary, ordinal or multinomial for categories, Poisson or negative binomial for counts. Send me a description of your outcome and I’ll confirm the right model before you order.
Can you handle multicollinearity, overdispersion and excess zeros?
Yes. I check VIF for multicollinearity and dispersion statistics for count models. Overdispersion is handled with negative binomial or quasi-Poisson models, excess zeros with zero-inflated or hurdle models, and assumption problems with robust standard errors.
Will I understand the results?
Yes. I explain every odds ratio, incidence rate ratio and coefficient in plain language: what it means, whether it matters in practice, and how to report it. Effect plots show predicted probabilities or counts so results are easy to present.
What do you need from me?
Your dataset (Excel, CSV, SPSS .sav or Stata .dta), the outcome variable, the predictors you want to test, and your research question or hypotheses. If you must follow a journal or reporting format, please share it.
Can you review a model I already ran?
Yes. If you already ran a model, I can check the specification, diagnostics and interpretation, and tell you what to fix. A single-model review fits the Basic package.
