Browse categories
Explore
Fiverr Pro
English
$
USD

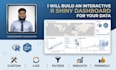
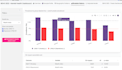
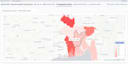
Turn your spreadsheets into a live, interactive dashboard your team can actually use.
I build data dashboards in R Shiny (and Python Streamlit/Dash on request) the kind where
you click a filter and the whole chart updates, not a static PDF that's outdated next week.
WHAT YOU GET:
Interactive filters, dropdowns, date ranges explore your own data, no coding needed
Charts, tables, and KPI cards in one clean interface
Hosted link you can share with your team, or source code to run yourself
Built on a statistics background so trends and comparisons are accurate, not just pretty
COMMON USE CASES:
- Sales/revenue tracking dashboards
- Survey or research data explorers
- Operations & KPI monitoring
- Health/survey data dashboards (my specialty area)
Send me your data and the questions you want the dashboard to answer
I'll turn it into something you can click through as fast as possible.
Statistician and Research Data Analyst
Languages
Do I need to clean my data before sending it to you?
Not necessarily! While having relatively organized data helps, I can handle the data cleaning, preprocessing, handling missing values, and structuring as part of the Standard and Premium packages.
Will I receive the actual Python or R source code?
Yes, absolutely. Transparency is a priority. Depending on the environment we choose, you will receive the fully commented, clean source code as a .py script, .R script, .ipynb (Jupyter Notebook), or .Rmd (R Markdown) file so you or your team can run and modify it in the future.
Can you build dashboards that update automatically with live data?
Yes! Using Python (Streamlit/Dash) or R (Shiny), I can connect your dashboard to live data streams, APIs, or cloud databases (like AWS, Google BigQuery, or PostgreSQL) so your charts automatically refresh when your data updates.
Why should I choose a Python/R gig over a Power BI or Tableau gig?
Traditional BI tools are great, but they are limited by software constraints and subscription fees. Python and R offer infinite customization.
Do you host the interactive dashboards (Streamlit / R Shiny) for me?
I will build, style, and fully optimize your application and provide the complete deployment-ready code. I will also guide you through the free hosting setup process (such as Streamlit Community Cloud or Shinyapps.io).
How do you handle data privacy and corporate confidentiality?
Data security is treated with the utmost seriousness. Your business data is used strictly for the duration of the project to build your visualizations and is deleted from my local systems upon project completion. I am completely open to signing a Non-Disclosure Agreement (NDA).


