Browse categories
Explore
Fiverr Pro
English
$
USD


About This Gig
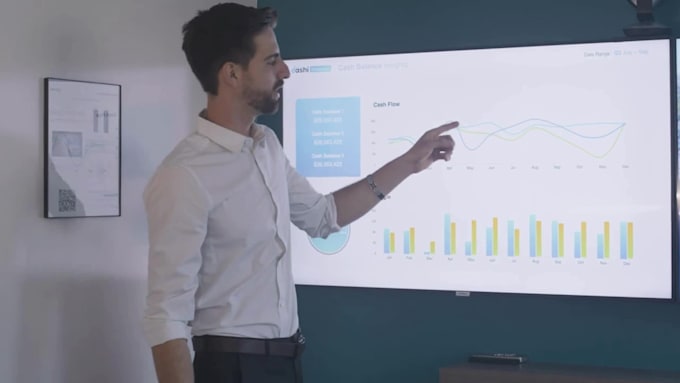
Need clear and impactful Excel charts? I'm here to help!
I'll transform your raw data into professional visuals and dashboards that make insights easy to understand and present.
Services Provided
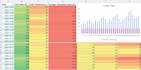
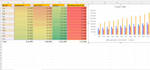
Charts & Graphs - I'll create bar charts, line graphs, histograms, pie charts, scatter plots, and more based on your data.
Interactive Dashboards - I'll design dynamic dashboards with slicers, filters, and visuals for easy decision-making.
Custom Visualization - Need a specific type of chart? I'll tailor visuals to your requirements.
Data Analysis - I'll highlight key trends, comparisons, and summaries through clear visuals.
Report-Ready Formatting - I'll design charts with a clean, professional look, ready for reports, presentations, or business use.
Why Choose My Service?
️ Expert in Excel charting & data visualization
️ Custom solutions for your unique needs
️ Clear, professional, and presentation-ready visuals
️ Friendly communication and quick delivery
excel data entry, cleaning, visualization and your virtual assistant
Languages
What do you need from me to get started?
I just need your Excel file (or CSV/Google Sheets) with the raw data. If you have a preferred chart type or dashboard idea in mind, please let me know — otherwise, I’ll suggest the best option.
What types of charts and visuals can you create?
I can create bar charts, line charts, pie charts, histograms, scatter plots, pivot charts, combo charts, and even interactive dashboards with slicers and filters.
Can you help me decide which chart type is best for my data?
Absolutely! If you’re unsure, I’ll analyze your data and recommend the most effective visuals to highlight key insights.
Will the charts be editable later?.
Yes, all charts and dashboards I create in Excel will remain fully editable. You can update or change them anytime by adjusting your data
Do you also clean or organize data before creating visuals?
Yes, basic cleaning (like removing duplicates, formatting dates, and organizing columns) is included. For more complex cleaning, you can order extra services.
Can you make the visuals presentation-ready?
Of course! I’ll format charts with a clean, professional design that you can use directly in reports, slides, or business presentations.
Do you provide interactive dashboards?
Yes! I can build dashboards with slicers, timelines, and filters so you can interact with your data and view insights dynamically.
What if I don’t like the first version of the chart?
No worries — I provide revisions. I’ll adjust the visuals until you’re fully satisfied with the result.
Will my data remain private and secure?
Absolutely. I respect client confidentiality and never share your files with anyone. Your data stays 100% safe.