Browse categories
Explore
Fiverr Pro
English
$
USD



_zlusma.jpg)
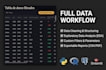
I am Pau, a dedicated Data Science student with a strong passion for turning complex, messy data into powerful visual stories. I specialize in using Python and R to build interactive, user-friendly applications and dashboards (using frameworks like Streamlit) that help you make data-driven decisions. Whether it's tracking long-term trends or finding hidden patterns, I apply strong analytical rigor to every project.
What you can expect from this Gig:
Why choose me?
IMPORTANT: Every data project is unique. Please send me a quick message with your data file and requirements before placi
Data Scientist
Languages
What kind of data formats do you accept?
I can work with all standard data formats, including Excel (.xlsx, .xls), CSV, JSON, and text files. If your data is in a different format or hosted on a specific database, please send me a message first so we can discuss the integration!
Will I need to install any software to use the interactive dashboard?
Not at all! If you choose the web hosting extra, I will deploy your interactive application online (using cloud platforms tailored for Streamlit or similar frameworks). You will simply receive a web link that you can open in any browser. If you prefer to run it locally, I will provide the full Pytho
What if my data is messy or has missing information?
Don't worry, real-world data is rarely perfect. Data cleaning and preprocessing are core parts of my workflow. I will handle missing values, format the columns correctly, and structure the dataset before doing any analytical work or visualization.
Do you provide the source code with the delivery?
Absolutely. I believe in full transparency. Along with the final dashboard or presentation, you will receive the fully commented Python and R scripts I used to clean your data and build the visualizations.
Can you handle large datasets with millions of rows?
Yes! Standard spreadsheet software often crashes with large datasets, but the programmatic approach I use is designed to handle heavy volumes of data efficiently. If your files are extremely large (multiple Gigabytes), just message me beforehand to ensure the optimal technical approach.


